
Figures & data
Table 1. DNA quantification and quality assurance by NanoDrop spectrophotometer.
Table 2. Reverse-transcribe and QRT-PCR primers.
Figure 1. The definition of relationship between CPG and transcript regions.
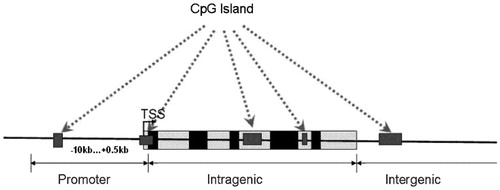
Figure 2. DNA 385K Promoter of hydroxymethylated and unhydroxymethylated promoters. (A) Classification of all promoters, hydroxymethylated promoters, or unhydroxymethylated promoters with high (HCP), intermediate (ICP), and low (LCP) CpG content. (B) Breakdown of hydroxymethylation status for HCP, ICP, and LCP promoters. (C) Percentage of genes with hydroxymethylated promoters in CpG islands.
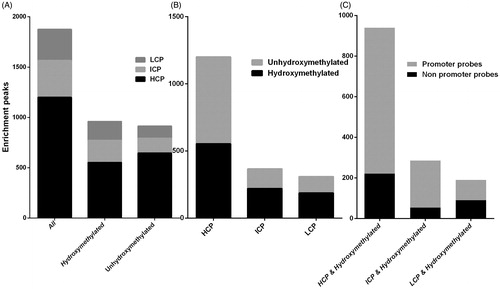
Figure 3. Different DNA hydroxymethylation level in the whole blood cells of uremia patients compared with the normal controls. (A) Different DNA hydroxymethylation level in Gene Promoter (−800 bp to +200 bp): in the whole blood cells of uremia patients compared with the normal controls. (B) Different DNA hydroxymethylation level in CpG Islands: in the whole blood cells of uremia patients compared with the normal controls.
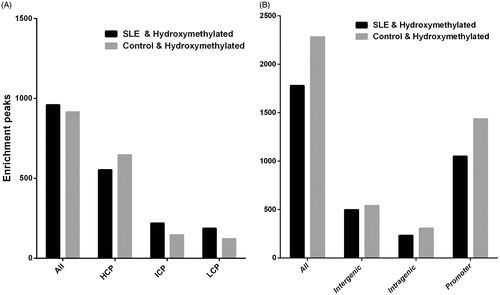
Figure 4. Pie charts showing the chromosomal location of the upregulated genes in uremia patients that compared to normal controls. (A) Pie charts showing the chromosomal location of the 960 genes that are upregulated in Gene Promoter (clockwise from chromosome 1 to X and Y sex chromosomes). The percentage of genes upregulated on the chromosome 1 and 19 is 8.96%. (B) Pie charts showing the chromosomal location of the 1780 genes that are upregulated in CpG Islands (clockwise from chromosome 1 to X and Y sex chromosomes). The percentage of genes upregulated on the 19 chromosome is 9.66%.
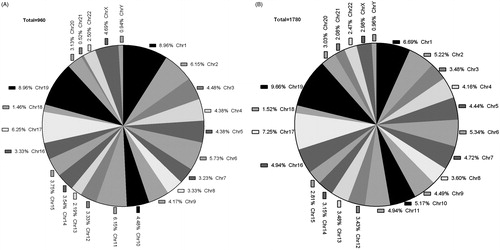
Table 3. The selected 15 genes with hydroxymethylation alterations between uremia and normal controls, identified by hMeDIP-chip.
Table 4. QRT-PCR verification results.