Figures & data
Figure 1. General viewpoint about IgAN pathogenesis.2,3 (A) Structure of human polymeric IgA1 (pIgA1) and the O-glycosylation sites. pIgA1 occurs predominantly in a dimeric form that is composed of two IgA1 monomers and J chain. In IgA between the first (Cα1) and second (Cα2) constant-region domains is hinge region (HR) which is different in IgA1 (chain α1) and IgA2 (chain α2). Within IgA1, HR is rich in proline (Pro/P), threonine (Thr/T), and serine (Ser/S) amino acid residues and up to six glycans are attached to an oxygen molecule of a serine or threonine residue (O-linked). (B) O-glycan variants of IgA1. In healthy person, Thr and Ser residues in IgA1 HR are normally extended like the nos. 3–6, while in IgAN patients are as the nos. 1 and 2. (C) Sketch of IgA1 metabolism in IgAN. GaNAC, N-acetylgalactosamine; Gal, galactose; SA, sialic acid; Gd-IgA1, galactose-deficient IgA1; CICs, circulating immune complex; ASGP-R, asialoglycoprotein receptor.
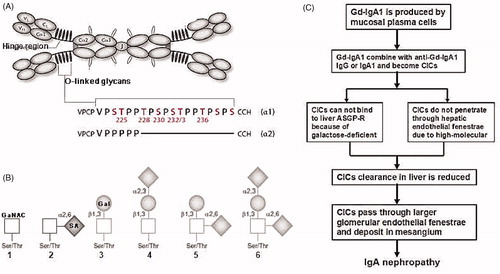
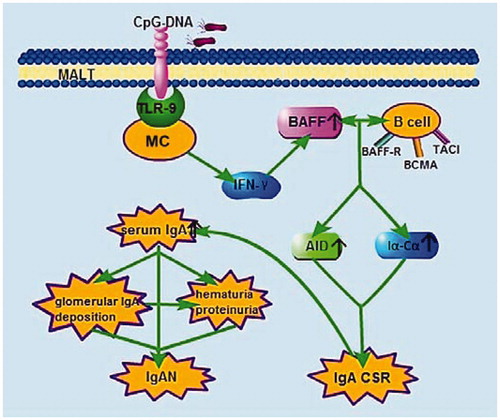
Figure 2. Sketch of TLR9-BAFF-IgA CSR signaling axis result in IgA over production. TLR9 can be expressed by mononuclear cells (MC), such as B cells and plasmacytoid dendritic cells, and its natural ligand is CpG-DNA. After MALT (for example tonsil) was infected, CpG-DNA in pathogenic bacteria recognized by TLR9 and induced cytokines releasing, mainly IFN-γ. These cytokines up-regulate expression of BAFF, which interact with B cells and induce CD40-independent IgA CSR. Finally, IgA, especially IgA1, was over produced, therefore, aggravate and lead to IgAN. MALT, mucosa-associated lymphoid tissues.