
Figures & data
Table 1. Descriptive characteristics for the study population.
Figure 1. Correlation between body mass index and fat tissue index. Y = 0.65x + 18.5. R Pearson = 0782. p = 0.001.
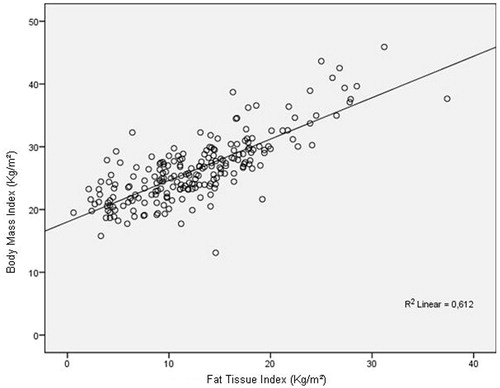
Figure 2. Correlation between body mass index and erythropoietin resistance index. Y = −0.3x + 13.3. R Spearman = −0.161. p = 0.03.
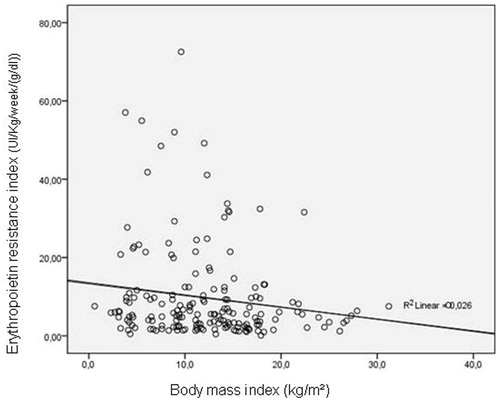
Table 2. Correlation (Rho Spearman test) between ERI and the other variables in patients receiving ESA (N = 182).
Table 3. Univariate association between patients with ERI < 10.1 and > 10.1 (IU/week/kg/Hb concentration [g/dL]) in those receiving ESA (N = 182).
Table 4. Multivariate binary logistic regression analysis among patients with ERI > > 10.1 (IU/week/kg/Hb).