Figures & data
Figure 1. Effect of NML on renal function indices after LPS administration in mice (mean±SD, n = 6). Note: *p < 0.05 versus the sham group; #p < 0.05 versus the LPS group.
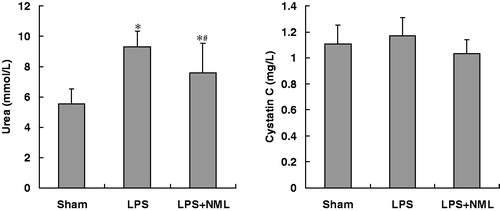
Figure 2. Effect of NML on renal morphological change in mice (HE staining). Note: A–B: Sham group; C–D: lipopolysaccharide (LPS) group; E–F: LPS + NML group.
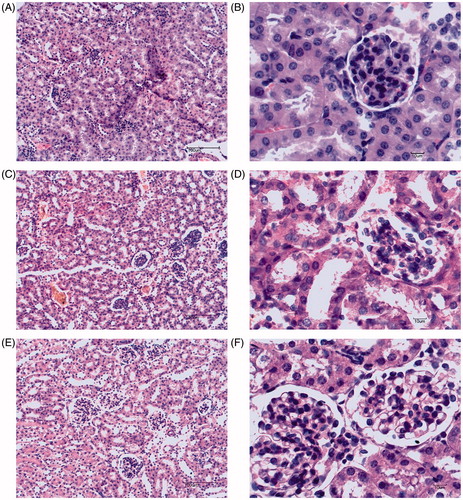
Table 1. Effects of NML on the phosphorylation levels of p38 MAPK, ERK 1/2, and c-Jun NH2-terminal protein kinase (JNK) in kidney after LPS administration in mice (ng/mg protein, mean±SD, n = 6).
Figure 3. Effects of NML on the levels of LBP and CD14 in kidney after LPS administration in mice (mean ± SD, n = 6). Note: *p < 0.05 versus the sham group; #p < 0.05 versus the LPS group.
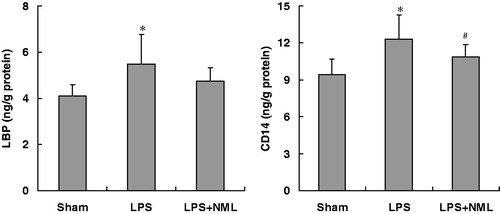
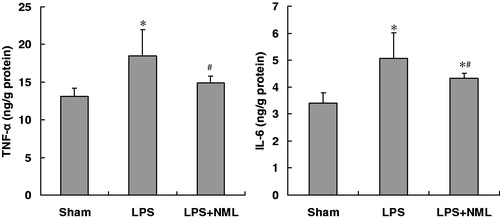
Figure 4. Effects of NML on the levels of TNF-α and IL-6 in kidney after LPS administration in mice (mean ± SD, n = 6). Note: *p < 0.05 versus the sham group; #p < 0.05 versus the LPS group.