
Figures & data
Figure 1. Magnitude of renal infarction. Shaded area was noted as infarction area. 1-A (less than 25%); 1-B (25–50%); 1-C (more than 50%).
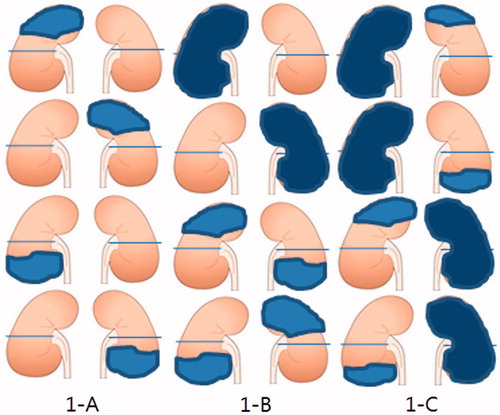
Table 1. Baseline characteristics, underlying disease, and clinical manifestations of patients with renal infarction.
Table 2. Initial and maximal laboratory values in the patients with renal infarction.
Table 3. Comparison of laboratory findings according to magnitude of renal infarction.
Table 4. Comparison of clinical and laboratory parameters in the patients with renal infarction according to the development of AKI.
Table 5. Comparison clinical data in the patients with renal infarction according to with/without CRF.
Table 6. Comparison of clinical and laboratory parameters in the patients with renal infarction according to the progression of CKD.