Figures & data
Figure1. Flow diagram of included/excluded studies.
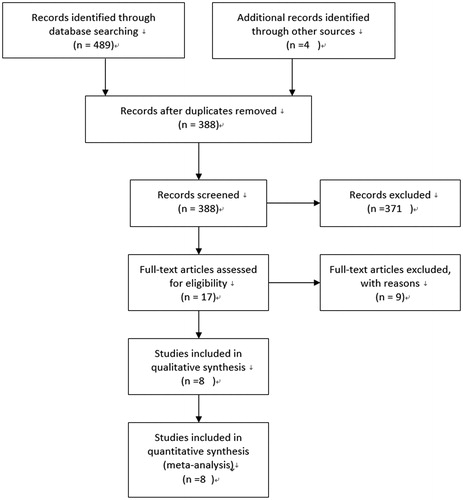
Table 1. Characteristics of studies included in this meta-analysis.
Table 2. Summary of different comparative results.
Figure 2. Forest plots of the susceptibility of IgA nephropathy associated with TGF-β1-509C/T (TT+CT vs. CC).
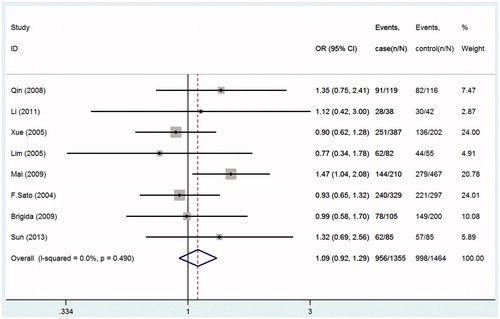
Figure 3. Forest plots of the susceptibility of IgA nephropathy associated with TGF-β1-509C/T (TT+CT vs. CC).
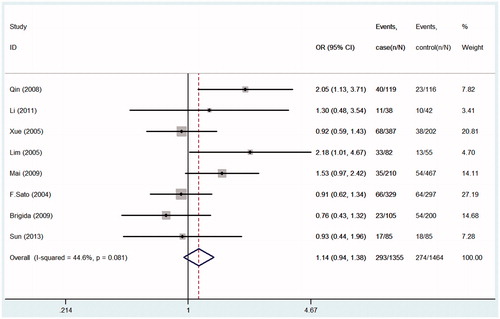
Figure 4. Forest plots of the susceptibility of IgA nephropathy associated with TGF-β1-509C/T (CC vs. TT).
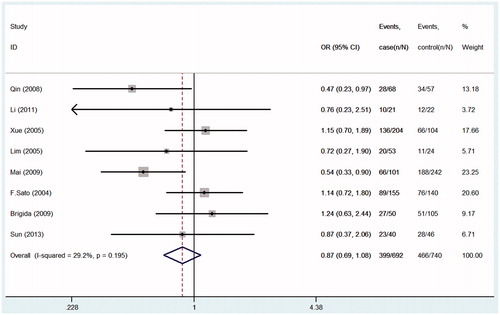
Figure 5. Forest plots of the susceptibility of IgA nephropathy associated with TGF-β1-509C/T (C allele vs. T allele).
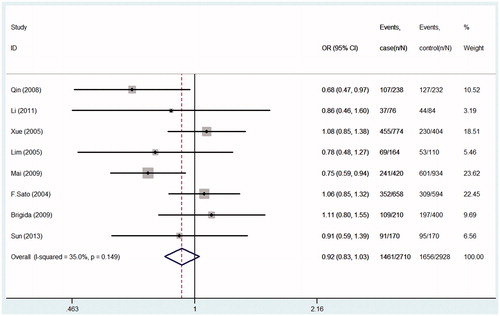
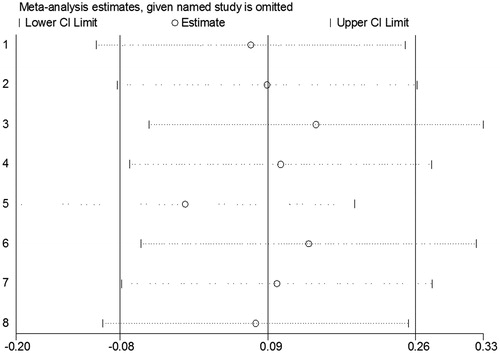
Figure 6. The results of sensitivity analysis from fixed-effects estimates.
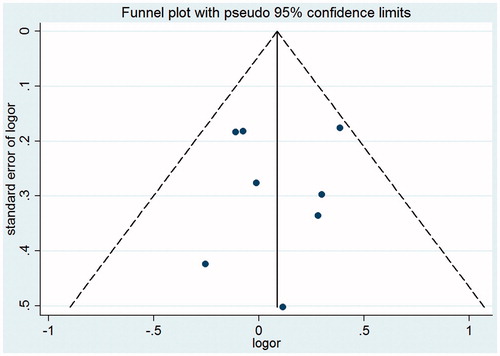
Figure 7. Begg’s funnel plot for publication bias test (CT+TT vs. CC).