Figures & data
Table 1. Data are show as mean ± standard deviation, median (min–max) or number (%).
Figure 1. Linear regression plot. LVMI (g/m2) versus eGFR (mL/min). Negative correlation was found between the two parameters (r = −0.489, p < 0.001).
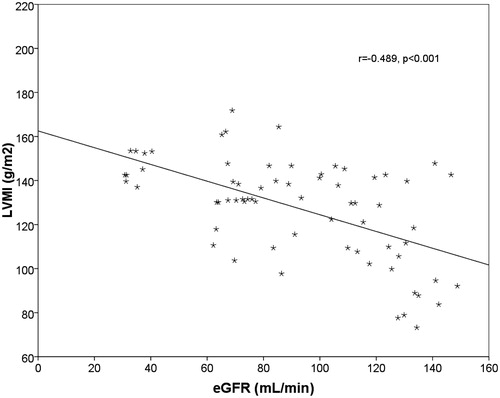
Figure 2. Linear regression plot. LVMI (g/m2) versus NT-proBNP (pg/dL). Positive correlation was found between the two parameters (r = −0.491, p = 0.017).
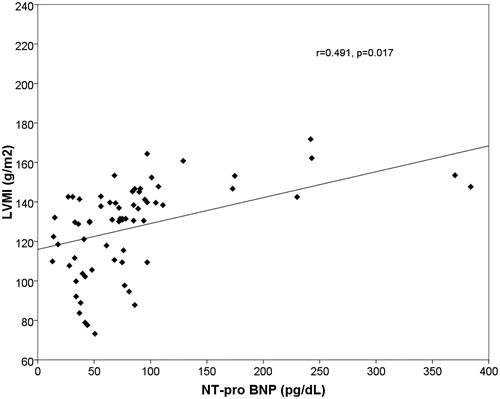
Figure 3. Bar charts with error bars. NT-proBNP (pg/dL) was significantly greater in eGFR 30–89 group (stages 2–3 KDOQI) compared to the control group. Boxes represent means; error bars indicate standard deviation (264.2 ± 155.1 vs. 109.2 ± 56.3, p < 0.001).
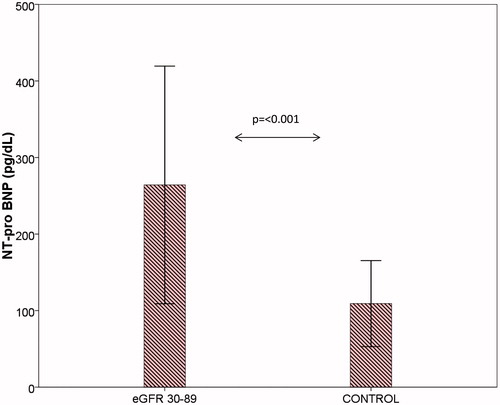
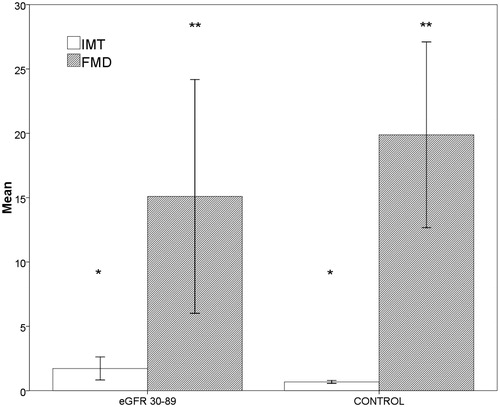
Figure 4. Bar charts with error bars. IMT (+%) was significantly greater in eGFR 30–89 group (stages 2–3 KDOQI) compared to the control group (*p < 0.001, 1.7 ± 0.9 vs. 0.7 ± 0.1), FMD (mm) was significantly lower (**p = 0.048, 15.1 ± 9.1 vs. 19.9 ± 7.2). Boxes represent means; error bars indicate standard deviation.