Figures & data
Table 1. Extraction properties of the freeze-dried GSEs and the efficiency of the extraction procedure.
Table 2. Phenolic content (on a dry matter basis) and antioxidant activity (FRAP method) of grape seeds obtained from the wastes of grape molasses production.
Table 3 Gallic acid, catechin and epicatechin contents of freeze-dried extracts of grape seeds.
Table 4. Experimental groups and study flowchart.
Figure 1. Comparison of total oxidative status (TOS) values across groups. Group 1; control group, Group 2; diabetic rats, Group 3; grape seed treated diabetic rats. *Group 2 versus Group 3; p < 0.05.
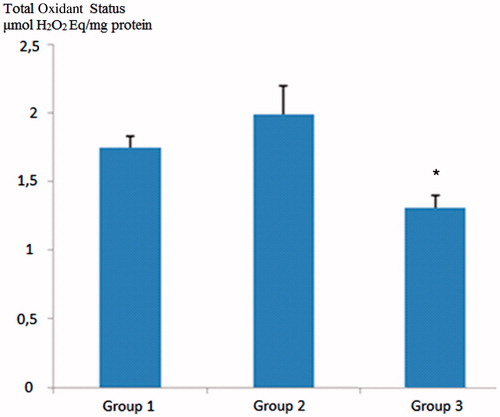
Figure 2. Comparison of total antioxidant status (TAS) values across groups. Group 1; control group, Group 2; diabetic rats, Group 3; grape seed treated diabetic rats. Group 1 versus Group 3; p: NS, Group 2 versus Group 3; p: NS.
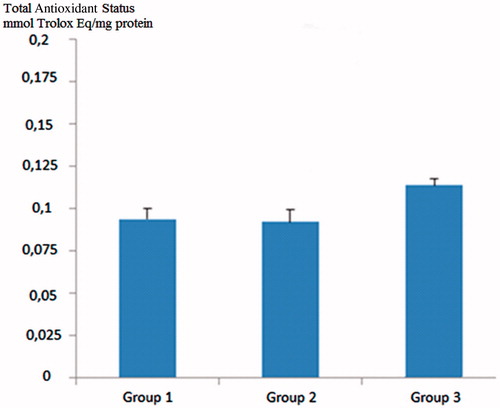
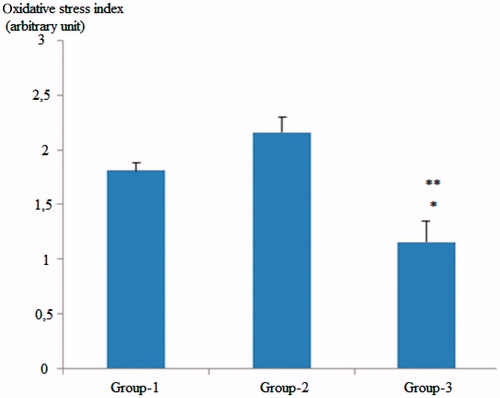
Figure 3. Comparison of oxidative stability index (OSI) values across groups. Group 1; control group, Group 2; diabetic rats, Group 3; grape seed-treated diabetic rats. *Group 1 versus Group 3; p < 0.001. **Group 2 versus Group 3; p < 0.001.