
Figures & data
Figure 1. Flow chart of identification of IgAN patients.
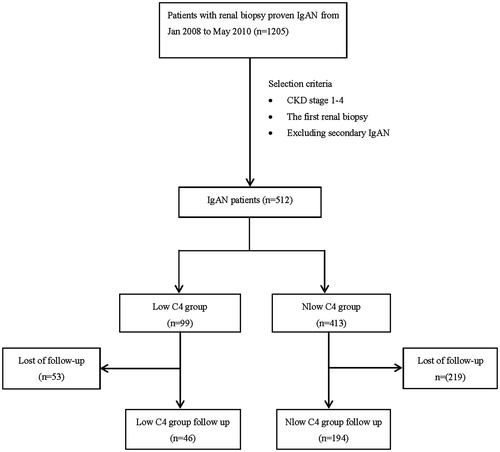
Table 1. Characteristics of IgAN patients with low level of serum C4 compared with those without low level of serum C4.
Table 2. Subgroup analysis of the characteristics of IgAN patients.
Table 3. Clinical characteristics of the follow-up patients compared with the lost to follow-up patients.
Figure 2. A Kaplan–Meier renal survival curve suggested the accumulative survival rate was lower in the LowC4 group than that in the NlowC4 group (p = 0.05).
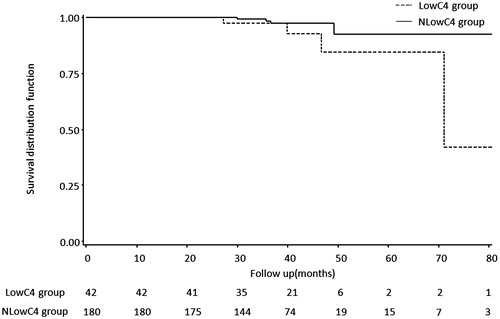
Table 4. Univariate and multivariate analysis of independent prognosis factors for the primary outcome.
Supplemental material