Figures & data
Figure 1. Induction of septic AKI mice with LPS treatment. (A) Serum urea and creatinine (SCr) were measured 24 h after LPS injection. Data shown as means ± SD of three independent experiments (p = 0.00071). Urine albumin to creatinine ratio was significantly increased in mice treated with LPS compared with healthy control mice. (19.51 ± 1.35 compared to 2.25 ± 0.9, p = 0.00067) (Upr/Ucr mg/mg). (C) Kidney sections was stained with PAS staining and checked under light microscope. Data shown here are one out of three independent experiments.
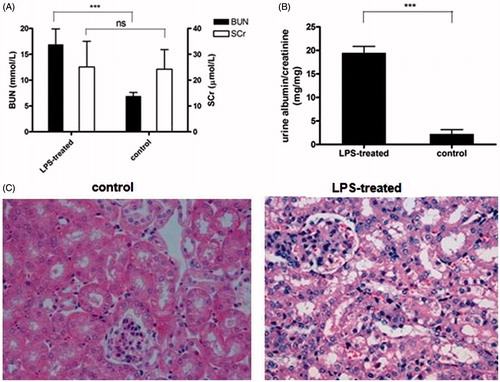
Figure 2. The overactivation of TLR2 in septic AKI mice kidney. (A) TLR2 mRNA level was assessed by realtime PCR (n = 10). Data shown as means ± SD of three independent experiments (p = 0.00082). (B) Distribution of TLR2 overactivation in the kidney of LPS-treated mice. TLR2 expression was detected by IHC analysis and visualized under light microscope. The overactivation of TLR2 was located in the glomerular resident cells: endothelial cells (arrow heads) and podocytes (arrow heads) in septic AKI mice.(C) Double immunofluorescence analysis to precise the distribution of TLR2 in the glomeruli, double labelings were shown that TLR2 (arrow heads) partially colocalized with synaptopodin a podocyte marker (left) and Tie2, an endothelial marker (right), as arrows shown. Data shown here are at least one out of three independent experiments.
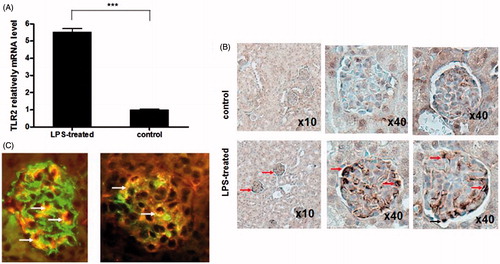
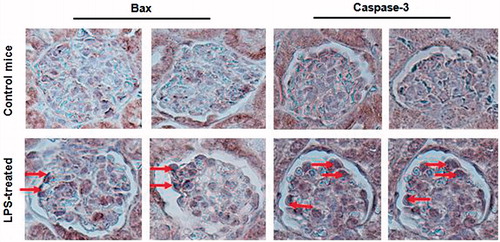
Figure 3. Increased Bax and Caspase-3 expression in the kidney of septic AKI mice. Bax (left) and Caspase-3 (right) expression was assessed by the IHC analysis and visualized under light microscope. Increased Bax and Caspase-3 expression in the kidney of septic mice (arrow heads).Data shown here are at least one out of three independent experiments.