Figures & data
Figure 1. Expression of toll-like receptors in kidney after IRI. (A) Western blot analysis of TLR-2 and −4 in kidney after IRI. β-Actin served as internal control for semiquantification of TLR-2 and −4. Relative protein levels of TLR-2 (B) and TLR-4 (C) were compared among different groups. Notes: Data shown are mean ± SEM; *statistically significant from sham group (p < 0.05); γstatistically significant from IR group (p < 0.01); n = 3 each.
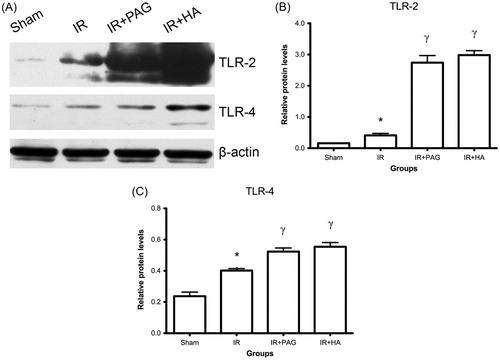
Figure 2. Increase of nuclear NF-κB p65, phosphorylated ASK1 and phosphorylated TRAF2 in kidney after IRI. (A) Western blot analysis of NF-κB p65, phosphorylated-ASK1 and TRAF2 in kidney after IRI. β-Actin served as internal control for semi-quantification of NF-κB p65, phosphorylated-ASK1 and TRAF2. Relative protein levels of NF-κB p65 (B), phosphorylated-TRAF2 (C) and ASK1 (D) were compared among different groups. Notes: Data shown are mean ± SEM; *statistically significant from sham group (p < 0.05); γstatistically significant from IR group (p < 0.01); n = 3 each.
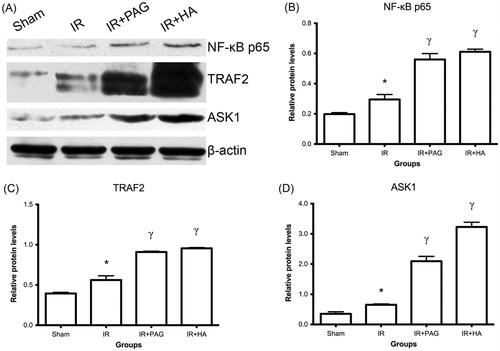
Table 1. Histological evaluation of kidney sections for each group.
Figure 3. Histological evaluation of kidneys after IRI. (A) Representative histological photographs of kidney tissues from different groups. (B) Detailed histological scores of each group. Notes: Data shown are individual values and medians; *statistically significant from sham group (p < 0.05); γstatistically significant from IR group (p < 0.05); n = 6 each.
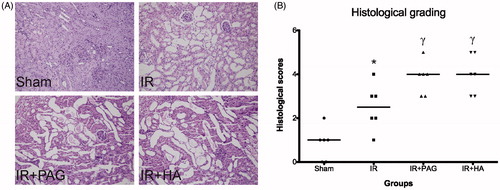
Figure 4. Expression of pro-inflammatory cytokines in kidney after IRI. Immunohistochemical analysis of IL-1β (A), IL-6 (B), IL-18 (C) and TNF-α (D) in kidney after IRI. Levels of IL-1β (E), IL-6 (F), IL-18 (G) and TNF (H) were compared among different groups. Notes: Data shown are mean ± SEM; *statistically significant from sham group (p < 0.01); γstatistically significant from IR group (p < 0.01); n = 6 each.
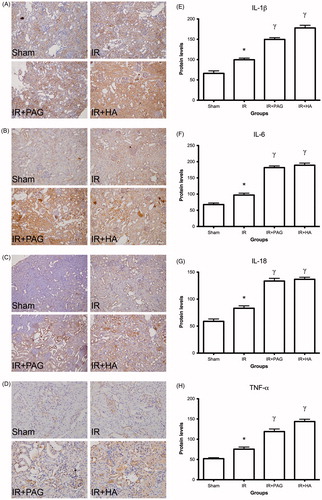
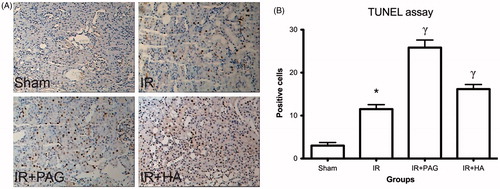
Figure 5. Apoptosis in kidney after IRI. (A) Representative photographs of TUNEL-stained kidney tissues from different groups. (B) Numbers of apoptotic cells were estimated and compared among different groups. Notes: Data shown are mean ± SEM; *statistically significant from sham group (p < 0.01); γstatistically significant from IR group (p < 0.05); n = 6 each.