Figures & data
Table 1. Baseline characteristics of the participants divided by sleep quality.
Figure 1. Box plot indicating PCS scores and PSQI; abbreviations: PCS: physical component summary, PSQI categorised: The Pittsburgh Sleep Quality Index categorised by the total score.
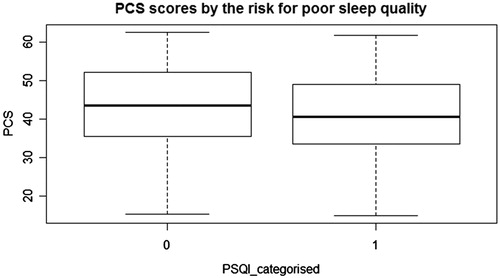
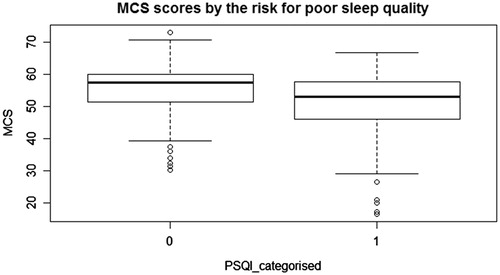
Figure 2. Box plot indicating MCS scores and PSQI; abbreviations: MCS: mental component summary scores, PSQI categorised: The Pittsburgh Sleep Quality Index categorised by the total score.