2,510
Views
21
CrossRef citations to date
0
Altmetric
Clinical Study

Sleep quality and its correlates in patients with chronic kidney disease: a cross-sectional design

, , &
Pages 757-762 | Received 28 Aug 2014, Accepted 26 Feb 2015, Published online: 18 Mar 2015

Figures & data

Table 1. Baseline characteristics of the participants divided by sleep quality.

Figure 1. Box plot indicating PCS scores and PSQI; abbreviations: PCS: physical component summary, PSQI categorised: The Pittsburgh Sleep Quality Index categorised by the total score.
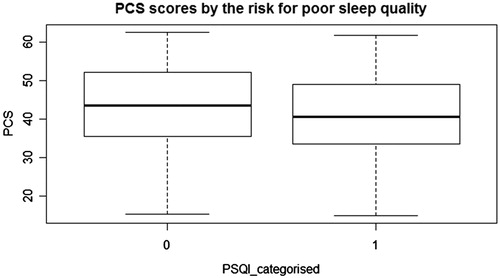
Figure 1. Box plot indicating PCS scores and PSQI; abbreviations: PCS: physical component summary, PSQI categorised: The Pittsburgh Sleep Quality Index categorised by the total score.

Figure 2. Box plot indicating MCS scores and PSQI; abbreviations: MCS: mental component summary scores, PSQI categorised: The Pittsburgh Sleep Quality Index categorised by the total score.
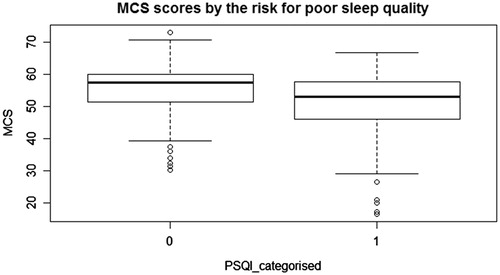
Figure 2. Box plot indicating MCS scores and PSQI; abbreviations: MCS: mental component summary scores, PSQI categorised: The Pittsburgh Sleep Quality Index categorised by the total score.

Table 2. Variables associated with sleep quality.

Reprints and Corporate Permissions

Please note: Selecting permissions does not provide access to the full text of the article, please see our help page How do I view content?

To request a reprint or corporate permissions for this article, please click on the relevant link below:

Academic Permissions

Please note: Selecting permissions does not provide access to the full text of the article, please see our help page How do I view content?

Obtain permissions instantly via Rightslink by clicking on the button below:

If you are unable to obtain permissions via Rightslink, please complete and submit this Permissions form. For more information, please visit our Permissions help page.