Figures & data
Figure 1. Flowchart of patient selection. INS, idiopathic nephrotic syndrome; SS, steroid-sensitive group; SR, steroid-resistant group; SRD, steroid resistance with drugs group; SRDF, steroid resistance with drugs and hemofiltration group; GC, glucocorticoid; MMF, mycophenolate mofetil; IHVHF, intermittent, high-volume hemofiltration.
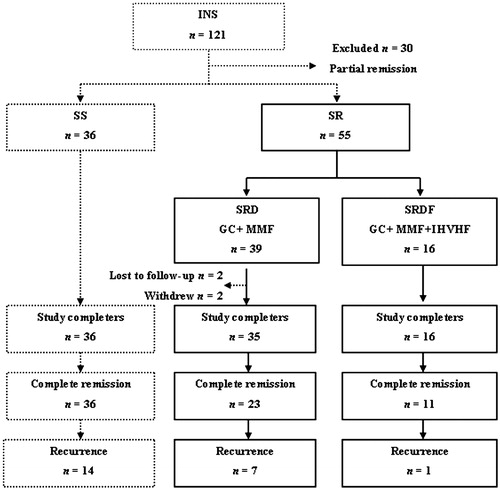
Table 1. Baseline clinical characteristics of the SRD- and SRDF-group patients.
Figure 2. Renal function and proteinuria remission during follow-up in patients in the steroid resistance with drugs (SRD) and steroid resistance with drugs and hemofiltration (SRDF) groups. (A) Cumulative complete remission. (B) Time to complete remission. (C) Complete remission at specific time points. (D) Serum creatinine. (E) Estimated glomerular filtration rate (eGFR). (F) Serum albumin. (G) Levels of 24 h urine protein excretion. (H) Proteinuria reduction in patients entering a complete remission. p Values are for SRD vs. SRDF, *p < 0.01.
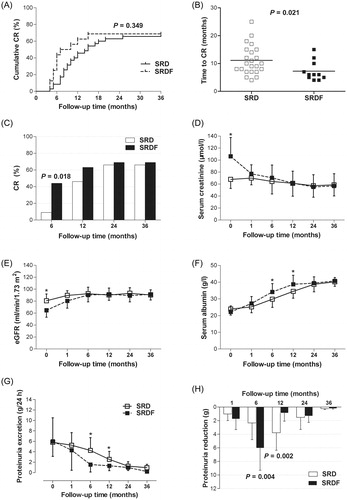
Figure 3. Influence of intermittent, high-volume hemofiltration (IHVHF) on serum cytokine levels in the patients in the steroid resistance with drugs and hemofiltration (SRDF) group. IL, interleukin.
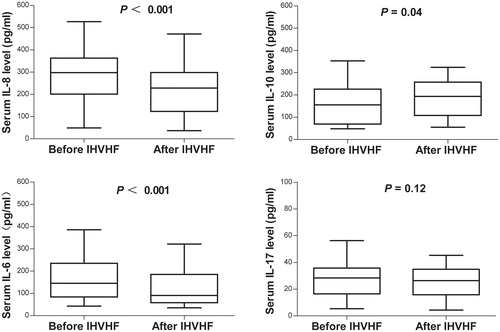
Table 2. Cytokine clearance (Cl) with intermittent, high-volume hemofiltration (IHVHF).
Table 3. Serum cytokine levels in controls and patients with idiopathic nephrotic syndrome (INS) at disease onset.
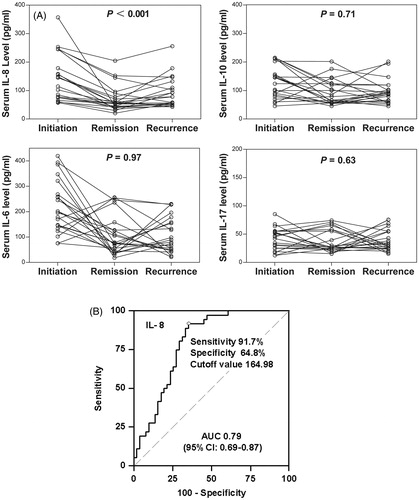
Figure 4. Relationship of serum interleukin (IL) levels with disease activity and sensitivity to glucocorticoids in patients with idiopathic nephrotic syndrome (INS). (A) Serum cytokine levels and INS activity. (B) Area under the receiver operating characteristic curve (AUC) suggests that serum IL-8 level at INS onset is a predictor of sensitivity to glucocorticoids.