Figures & data
Figure 1. Test flow chart.
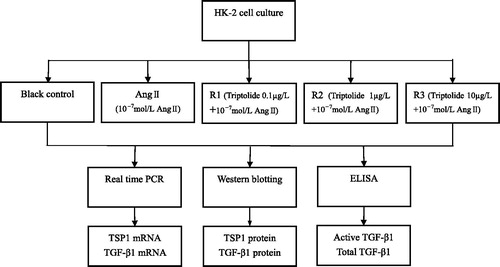
Figure 2. Effects of triptolide on expression of TSP1 and TGF-β mRNA in AngII-induced HK-2 cells (Real Time PCR). Note: Blank control (no any drugs were added); positive control (10−7 mol/L AngII only); R1: triptolide 0.1 µg/L + 10−7 mol/L AngII; R2: triptolide 1 µg/L + 10−7 mol/L AngII; R3: triptolide 10 µg/L + 10−7 mol/L AngII.
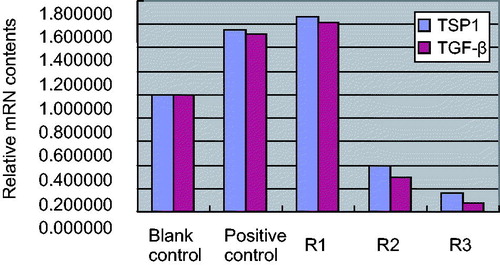
Figure 3. Effects of triptolide on expression of TSP1 and TGF-β protein in AngII-induced HK-2 cells. Note: Blank control (no any drugs were added); positive control (10−7 mol/L AngII only); R1: triptolide 0.1 µg/L + 10−7 mol/L AngII; R2: triptolide 1 µg/L + 10−7 mol/L AngII; R3: triptolide 10 µg/L + 10−7 mol/L AngII.
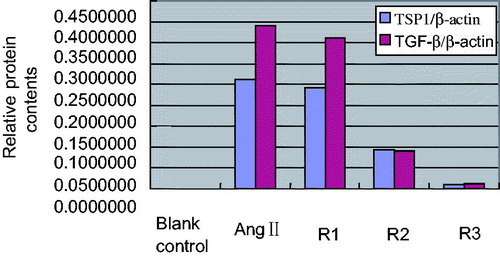
Figure 4. Effects of triptolide on expression of TSP1 and TGF-β protein in AngII-induced HK-2 cells. Note: Blank control (no any drugs were added); positive control (10−7 mol/L AngII only); R1: triptolide 0.1 µg/L + 10−7 mol/L AngII; R2: triptolide 1 µg/L + 10−7 mol/L AngII; R3: triptolide 10 µg/L + 10−7 mol/L AngII.
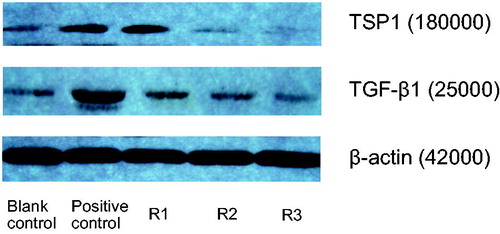
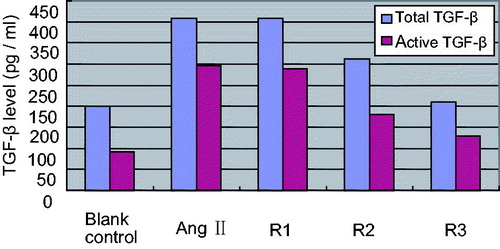
Figure 5. Effects of different concentration triptolide on levels of total and active TGF-β. Note: Blank control (no any drugs were added); positive control (10−7 mol/L AngII only); R1: triptolide 0.1 µg/L + 10−7 mol/L AngII; R2: triptolide 1 µg/L + 10−7 mol/L AngII; R3: triptolide 10 µg/L + 10−7 mol/L AngII.