Figures & data
Table 1. Clinical and laboratory data of our study.
Figure 1. MRI at presentation of PRES. T2-weighted image (A1) and FLAIR image (B1) show high signal abnormalities bilaterally in the parietooccipital regions, in both subcortical white matter and cortical gray matter. MRI after 2 weeks of follow-up shows complete disappearance of all high signal abnormalities in both T2-weighted image (A2) and FLAIR image (B2).
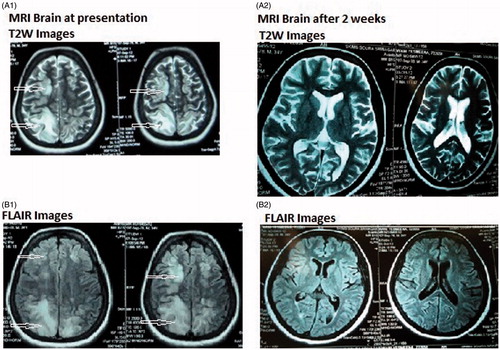
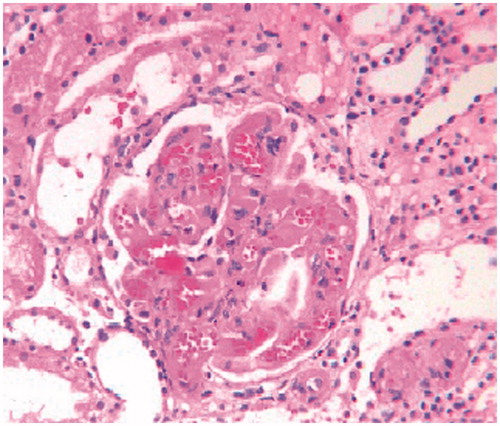
Figure 2. Glomerulus from a H & E stained section, showing significant loss of mesangial matrix, with a fluffy appearing remaining mesangial area and retraction of capillary tufts (mensagiolysis). The glomerular capillaries are congested and dilated (H&E × 250).
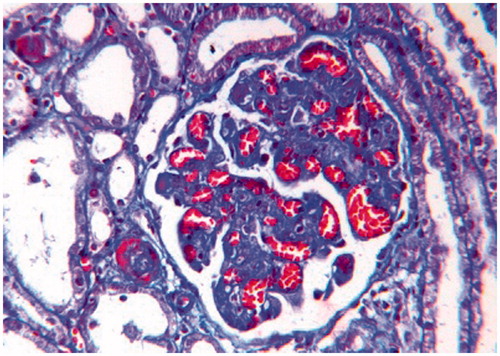
Figure 3. (A) Non-contrast CT head at presentation showing diffuse white matter and gray matter edema. (B) MRI brain of the same patient showing hyperintense lesions in parietooccipital area and cerebellar regions predominantly on the left side on T2W images.
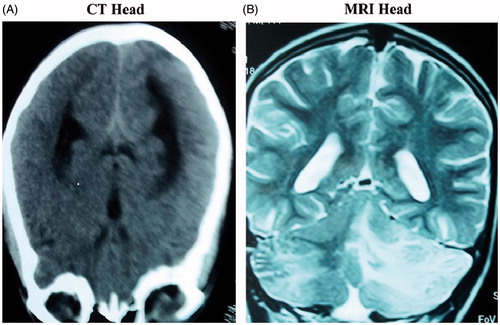
Figure 4. Photomicrographs showing ischemic shrinkage of capillary tufts with dilated and congested capillary lumina, loss of mesangial anchorage and presence of few fibrin thrombi in glomerular capillaries. (Masson's Trichrome × 250).