Figures & data
Figure 1. The effect of different mediums on PS, ROS and GSH of healthy erythrocytes. The arithmetic means ± standard error (mean ± SEM, n = 6) of PS, ROS and GSH following incubation for 24 and 48 h in Group C, U and L, respectively.
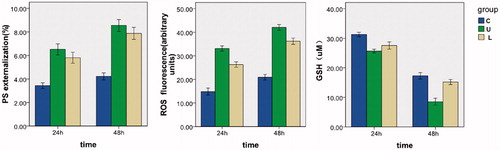
Figure 2. Original histogram of Annexin-V-binding of erythrocytes following exposure for 24 and 48 h to Group C, U and L. Blue area represents the quantity of Annexin-V-binding of erythrocytes. Fig.012 is Annexin-V-binding erythrocytes at 0 h. Fig.006, 014 and 004 are Annexin-V-binding erythrocytes at 24 h in Group C, U and L, respectively. Fig.015, 016 and 024 are Annexin-V-binding erythrocytes at 48 h in Group C, U and L, respectively.
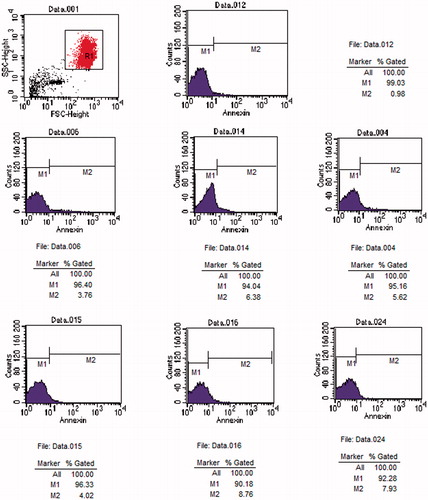
Table 1. The results of PS, ROS, GSH in different group (mean ± SEM).
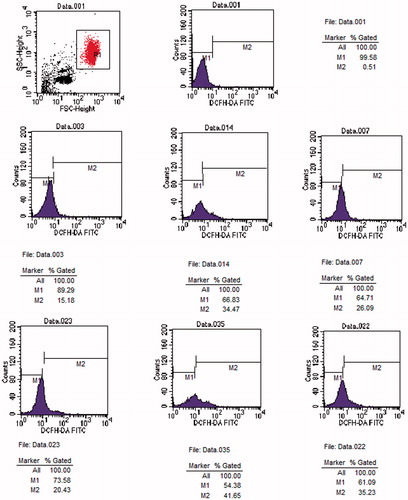
Figure 3. Original histogram of ROS of erythrocytes following exposure for 24 and 48 h to Group C, U and L. Blue area represents the quantity of ROS. Fig.001 is ROS at 0 h. Fig.003, 014 and 007 are ROS at 24 h in Group C, U and L, respectively. Fig.023, 035 and 048 are ROS at 48 h in Group C, U and L, respectively.