Figures & data
Table 1. Patient demographic and biochemical data.
Table 2. Spearman correlation coefficients for λ sFLC, κ/λ ratio, creatinine and eGFR in Group 1 patients.
Figure 1. Serum kappa-free light-chain concentrations in Group 1 patients. Kappa sFLC increased dramatically in CKD stages (p < 0.05).
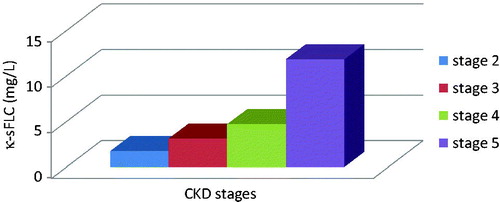
Figure 2. Serum lambda-free light-chain concentrations in Group 1 patients. Serum-free lambda light chains increased progressively with each CKD stage (p < 0.05).
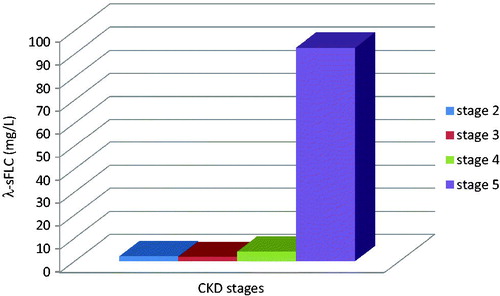
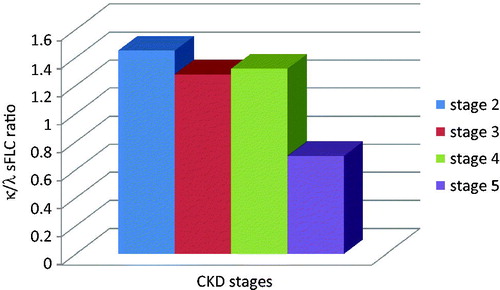
Figure 3. Serum-free kappa/lambda ratio in Group 1 patients. Serum-free kappa/lambda ratio decreased dramatically in CKD stage 5 (p < 0.05).