Figures & data
Table 1. The clinical baseline of subjects.
Table 2. Univariate logistic regression analysis for cardiovascular autonomic neuropathy.
Table 3. Multiple logistic regression analysis to include body mass index and chronic kidney disease for cardiovascular autonomic neuropathy.
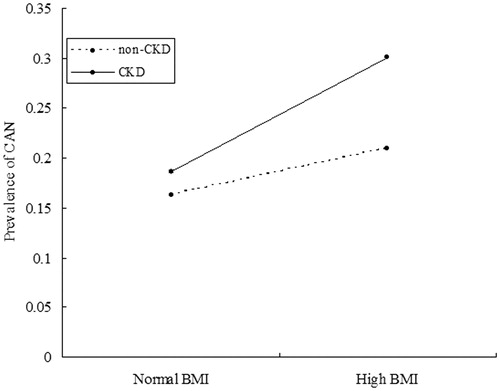
Figure 1. Interaction analysis of body mass index (BMI) and chronic kidney disease (CKD) on cardiovascular autonomic neuropathy (CAN). In subjects with normal BMI, the prevalence of CAN was 16.30% and 18.58% in those subjects with non-CKD and CKD, respectively. In subjects with high BMI, the prevalence of CAN was 20.97% and 30.02% in the subjects with non-CKD and CKD, respectively. CKD was defined as the presence of albuminuria or an eGFR <60 mL/min/1.73 m2.