Figures & data
Figure 1. Box figure of expression value before (A) and after normalization (B) (the horizontal axis represents samples, while the vertical axis represents expression value). The black line in the box was the median of every group of data, which can tell the extent of normalization. As can be seen from the figure, the black lines were almost on the same straight line, indicating a high level of normalization.
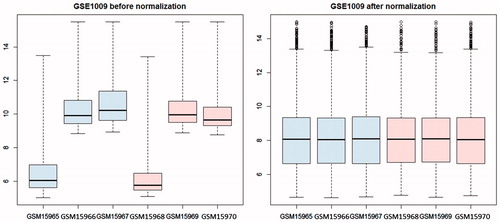
Table 1. The GO terms which DEGs in PPI network were enriched in.
Figure 2. PPI network construction in diabetic nephropathy. The nodes stand for DEGs (differentially expressed genes) and the lines stand for the interactions between two proteins.
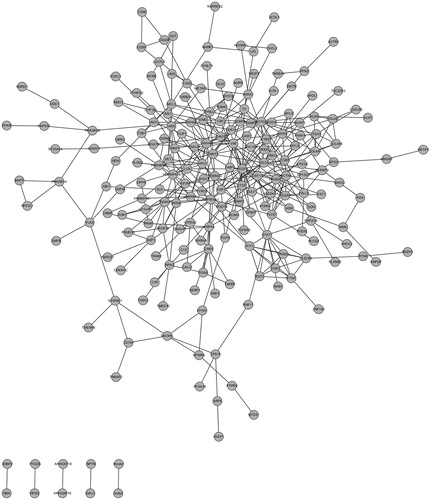
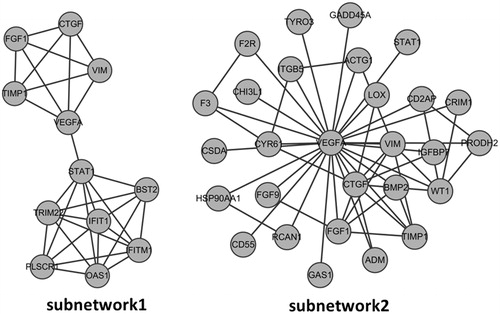
Figure 3. Subnetwork 1 was obtained by MCODE while subnetwork 2 was established based on the first nodes of hub proteins. The nodes stand for DEGs and the lines stand for the interactions between two proteins. (A) Subnetwork 1; (B) Subnetwork 2.