Figures & data
Table 1. Comparison between PNL and control groups.
Table 2. Early renal injury markers in patient with urolithiasis who underwent percutaneous nephrolithotripsy (PNL).
Table 3. Differences (p values) in the early kidney injury markers/creatinine ratios between the first measurements and the control groups.
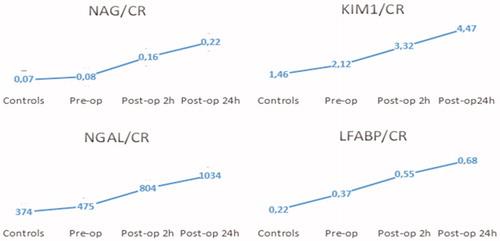
Figure 1. Urinary biomarkers measured in the control and patient group with preoperative and postoperative values.