
Figures & data
Figure 1. (A) The morphology of rabbit BM-MSCs, Scale bar, 50 μm. (B) The phenotypes of BM-MSCs analysis by FCM at third passages. FCM analysis revealed that BM-MSCs were positive for CD44 and CD71 and negative for CD34 and CD45.
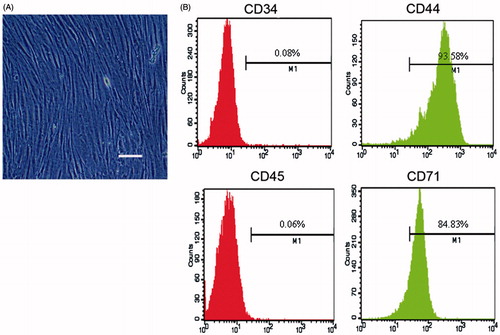
Figure 2. Prussian blue staining of SPIO labeled BM-MSCs, and the efficiency is up to 100%. Note: Scale bar, 50 μm.
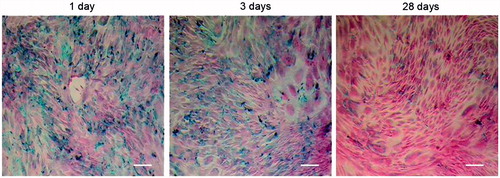
Table 1. The average viability of SPIO-MSCs by Trypan blue staining test.
Figure 3. Detectable time point of labeled cells on MRI in vitro (T2*WI). Notes: An increasing signal intensity of labeled cells is suspended in gelatin. Number of labeled cells are suspended in 50 L gelatin. On the T2*WI, there is a significantly lower signal intensity in 5 × 10⁴, cells/mL (A) and 5 × 10⁵ cells/mL SPIO-MSCs compared with unlabeled counterparts, but the signal intensity of week 3 with 5 × 10⁴ cells/mL and week 4 with 5 × 10⁵ cells/mL is almost the same as that of control group.
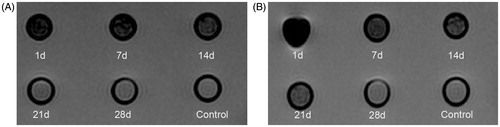
Figure 4. Histological detection of labeled SPIO-MSCs in kidneys. Prussian blue and H&E stains of kidney after AKI and application of labeled SPIO-MSCs, all pictures showed a predominant presence of cells in the renal medulla corresponding to the regions of signal loss in MRI. The regions of signal intensity in MRI is the lowest at 72 h after SPIO-MSCs administration. The kidneys show more uptake of iron oxide particles in the renal medulla cells caused by uptake of circulating iron oxide particles, the Scale bar, 50 μm.
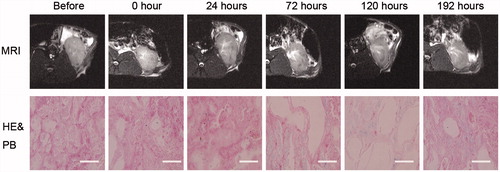
Figure 5. Construction of the AKI models. Notes: The upper panel showed the uninjured kidney, the lower panel showed the injured kidney after ischemia–reperfusion. The mid and right panel showed that Renal tubular endothelial cells edema, necrosis, and arrangement disorder. Scale bar, 30 μm.
