Figures & data
Table 1. Primer sequences for quantitative real-time PCR.
Figure 1. Body weight and kidney weight of rats from various groups. DM, diabetes mellitus group; V, vehicle; Ben, benazepril; LEF, leflunomide. Values are mean ± SEM; n = 8; *p < 0.05 versus control, #p < 0.05 versus vehicle-treated DM rats.
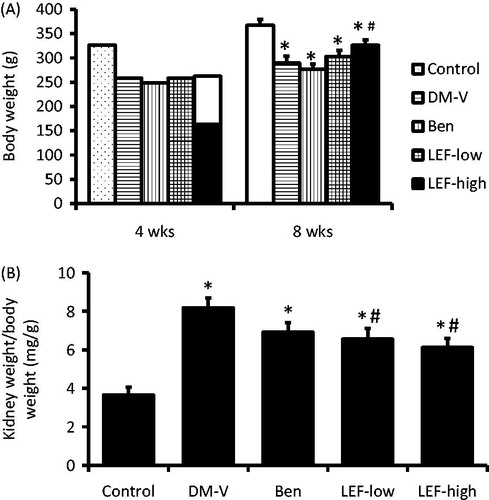
Table 2. The urine 24-h volume, 24-h urine protein and microalbumin.
Figure 2. Blood creatinine and urea nitrogen (BUN) of rats from various groups. DM, diabetes mellitus group; V, vehicle; Ben, benazepril; LEF, leflunomide. Values are mean ± SEM; n = 8; *p < 0.05 versus control, #p < 0.05 versus vehicle-treated DM rats.
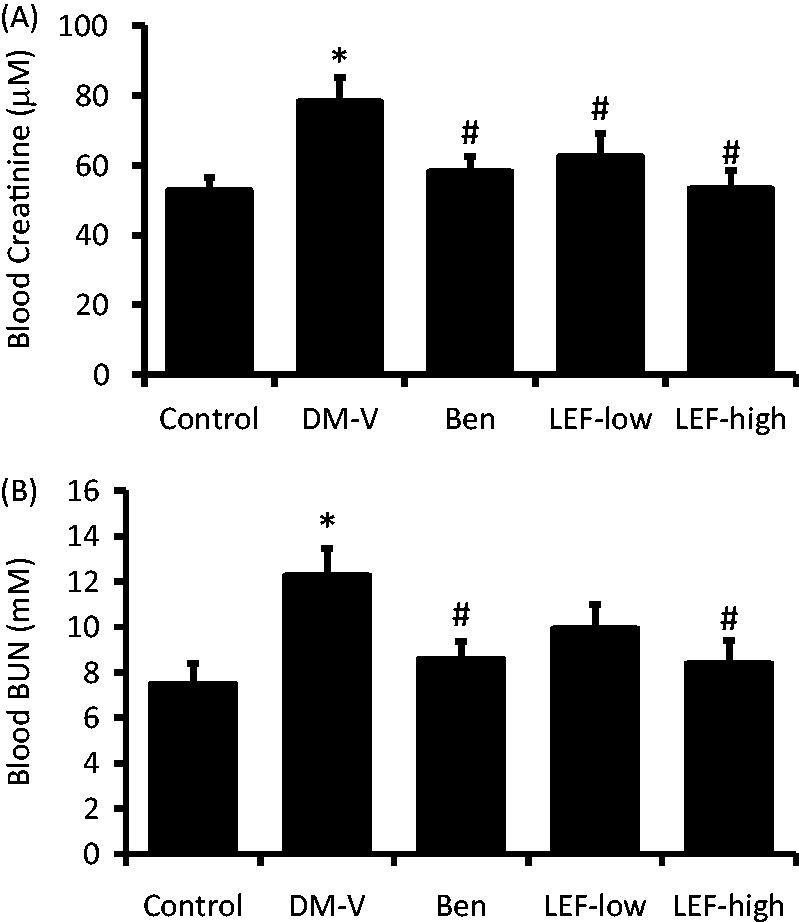
Figure 3. Representative hematoxylin & eosin staining (A) and PAS staining (B) in the kidney of rats from various groups. DM, diabetes mellitus group; V, vehicle; Ben, benazepril; LEF, leflunomide; Magnification = 400×.
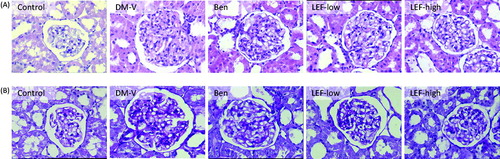
Figure 4. Renal α-SMA expression in diabetic rats treated with vehicle, benazepril or leflunomide for 8 weeks. (A) Representative images showing α-SMA staining in the kidney (Magnification = 400X). (B) α-SMA staining intensity quantified using ImageJ. (C) Renal α-SMA mRNA levels determined by real-time PCR. DM, diabetes mellitus group; V, vehicle; Ben, benazepril; LEF, leflunomide. Values are mean ± SEM; n = 8; *p < 0.05 versus control, #p < 0.05 versus vehicle-treated DM rats.
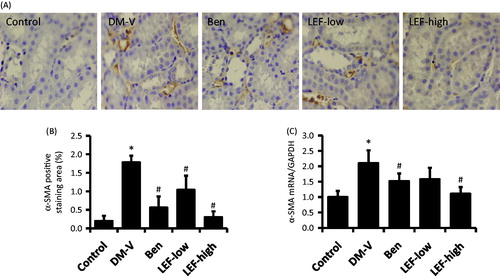
Figure 5. Renal CD68 expression in diabetic rats treated with vehicle, benazepril or leflunomide for 8 weeks. (A) Representative images showing CD68 staining in the kidney (Magnification = 400X). (B) CD68 staining intensity quantified using ImageJ. (C) Renal CD68 mRNA levels determined by real-time PCR. DM, diabetes mellitus group; V, vehicle; Ben, benazepril; LEF, leflunomide. Values are mean ± SEM; n = 8; *p < 0.05 versus control, #p < 0.05 versus vehicle-treated DM rats.
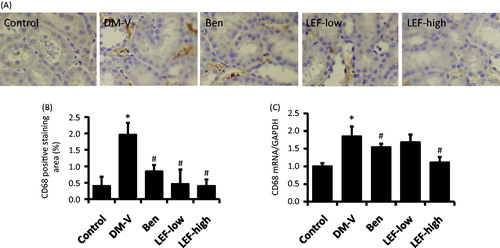
Figure 6. Renal TGF-β1 expression in diabetic rats treated with vehicle, benazepril or leflunomide for 8 weeks. (A) Representative images showing TGF-β1 staining in the kidney (Magnification = 400X). (B) TGF-β1 staining intensity quantified using ImageJ. (C) Renal TGF-β1 mRNA levels determined by real-time PCR. DM, diabetes mellitus group; V, vehicle; Ben, benazepril; LEF, leflunomide. Values are mean ± SEM; *p < 0.05 versus control, #p < 0.05 versus vehicle-treated DM rats.
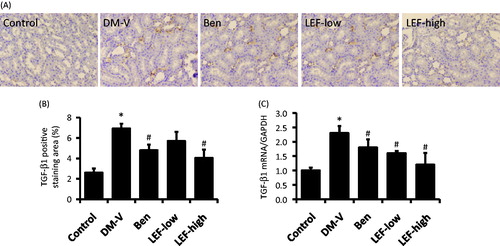
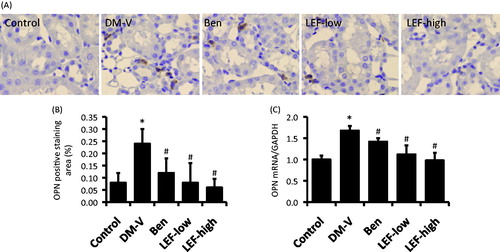
Figure 7. Renal OPN expression in diabetic rats treated with vehicle, benazepril or leflunomide for 8 weeks. (A) Representative images showing OPN staining in the kidney (Magnification = 400X). (B) OPN staining intensity quantified using ImageJ. (C) Renal OPN mRNA levels determined by real-time PCR. DM, diabetes mellitus group; V, vehicle; Ben, benazepril; LEF, leflunomide. Values are mean ± SEM; * p < 0.05 versus control, #p < 0.05 versus vehicle-treated DM rats.