Figures & data
Table 1. Effects of different time on body weight, kidney weight, fasting blood glucose and HbA1c levels in rats.
Figure 1. Renal histologic evaluation in the various treatment groups (HE ×200). Values (mean ± SD) were obtained for each group of 8 animals. ap < 0.05 compared to the values of normal rats (sham). bp, cp < 0.05 compared to the values of diabetic rats after 4 weeks and 8 weeks (4DM, 8DM), respectively.
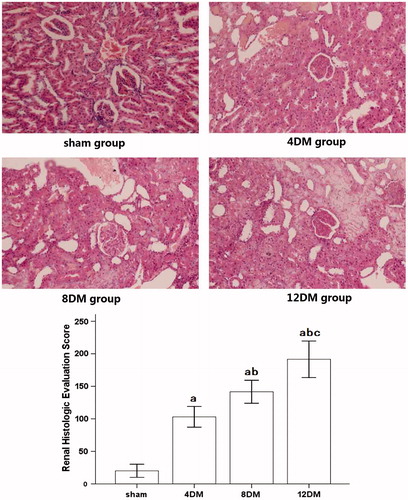
Figure 2. Serum Cys C (A) and β2-MG (B) levels in the different treatment groups. Values (mean ± SD) were obtained for each group of eight animals. ap < 0.05 compared to the values of normal rats (sham). bp, cp < 0.05 compared to the values of diabetic rats after 4 weeks and 8 weeks (4DM, 8DM), respectively.
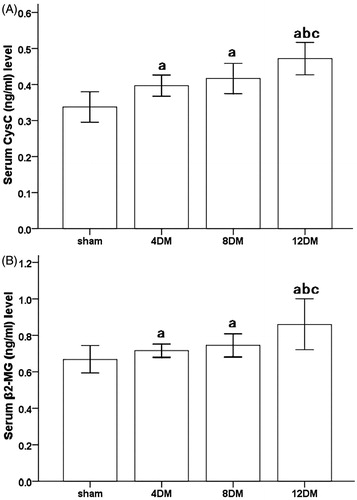
Figure 3. Renal tissues T-AOC (A) and MDA (B) levels in the different treatment groups. Values (mean ± SD) were obtained for each group of eight animals. ap < 0.05 compared to the values of normal rats (sham). bp, cp < 0.05 compared to the values of diabetic rats after 4 weeks and 8 weeks (4DM, 8DM), respectively.
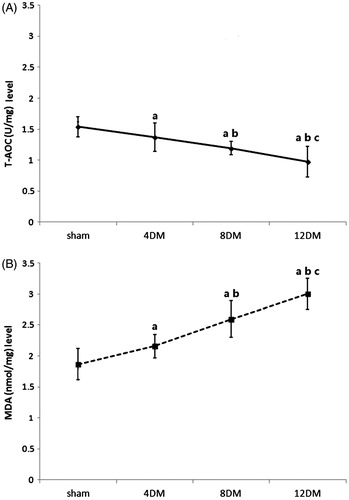
Figure 4. Correlation analysis between T-AOC and MDA levels with renal histologic evaluation score.
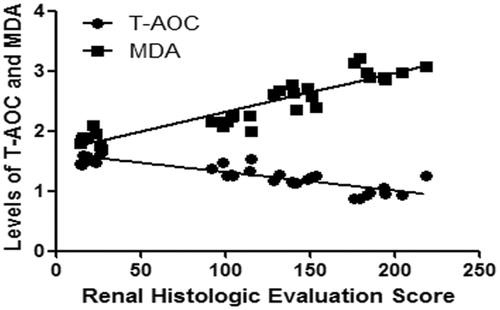
Figure 5. Expression of DJ-1 in renal tissues assessed by immunohistochemistry (SP ×400). Values (mean ± SD) were obtained for each group of eight animals. ap < 0.05 compared to the values of normal rats (sham). bp, cp < 0.05 compared to the values of diabetic rats after 4 weeks and 8 weeks (4DM, 8DM), respectively.
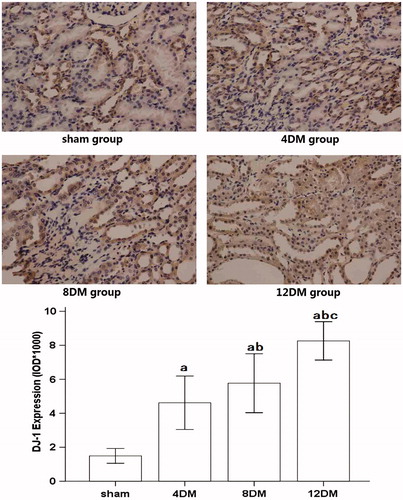
Figure 6. Expression of HO-1 in renal tissues assessed by immunohistochemistry (SP ×400). Values (mean ± SD) were obtained for each group of eight animals. ap < 0.05 compared to the values of normal rats (sham). bp, cp < 0.05 compared to the values of diabetic rats after 4 weeks and 8 weeks (4DM, 8DM), respectively.
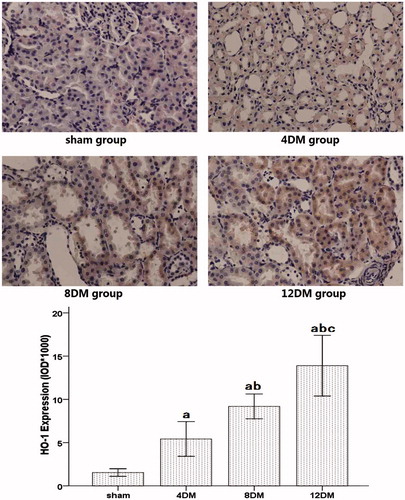
Figure 7. Expression of Nrf2 in renal tissues assessed by immunohistochemistry (SP ×400). Values (mean ± SD) were obtained for each group of eight animals. ap < 0.05 compared to the values of normal rats (sham). bp, cp < 0.05 compared to the values of diabetic rats after 4 weeks and 8 weeks (4DM, 8DM), respectively.
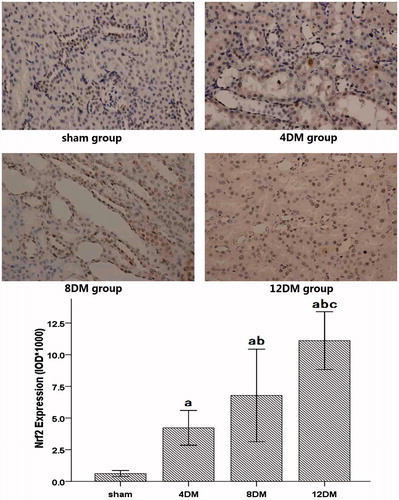
Figure 8. Expressions of DJ-1, Nrf2 and HO-1 in renal tissues as assessed by Western blot. A, Western blot analysis for the presence of DJ-1 and HO-1 in cytoplasmic proteins and Nrf2 in nuclear proteins. β-actin and Lamin B1 were used as the protein loading controls for DJ-1, HO-1 and Nrf2, respectively. B, C, D, DJ-1, HO-1 and Nrf2 protein contents were detected by densitometry. Values (mean ± SD) were obtained for each group of eight animals. ap < 0.05 compared to the values of normal rats (sham). bp, cp < 0.05 compared to the values of diabetic rats after 4 weeks and 8 weeks (4DM, 8DM), respectively.
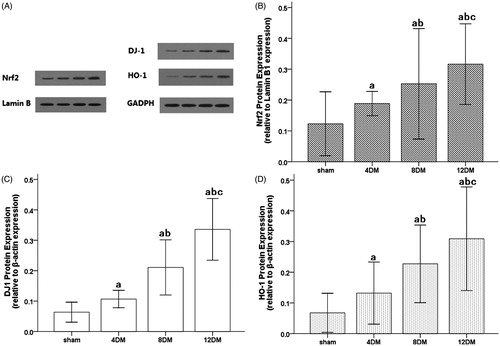
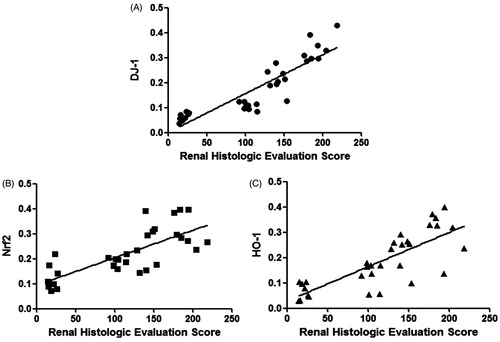
Figure 9. Correlation analysis between DJ-1 (A), Nrf2 (B) and HO-1 (C) expression with renal histologic evaluation score.