Figures & data
Table 1. Primer list.
Table 2. Serum biochemical parameters in different groups at week 4.
Figure 1. Effect of ozone therapy on tubulointerstitium morphology at week 4. H&E staining was performed in the kidneys of different groups, original magnification ×400 (A); MT staining was performed in the kidneys of different groups, original magnification ×200 (B). Bar graphs depict the statistical analyses of relative percentages of tubulointerstitial fibrosis in the kidneys of different groups after MT staining (C). Bars represent means ± SEM. *p < 0.05 versus ADE group; #p < 0.01 versus Sham group. H&E, hematoxylin and eosin; MT, Masson trichrome.
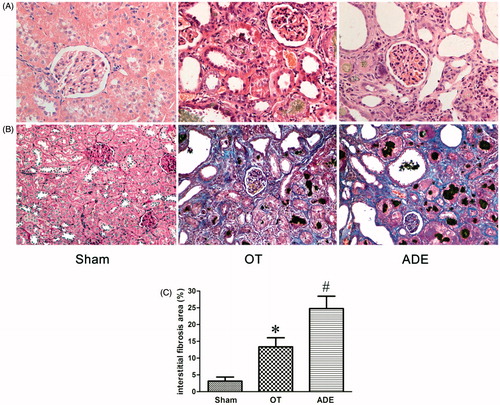
Figure 2. Effect of ozone therapy on inflammation-related cytokines in kidney at week 4. MCP-1 and TNF-α infiltration in the renal of different groups was detected by immunohistochemical staining (A), original magnification ×400. The protein level and mRNA level of MCP-1, TNF-α, IL-1β and IL-6 were respectively detected by Western blot analysis (B) and Real-time PCR analysis (C). Data were represented by mean ± SEM. *p < 0.05 versus ADE group; **p < 0.01 versus ADE group; #p < 0.01 versus Sham group.
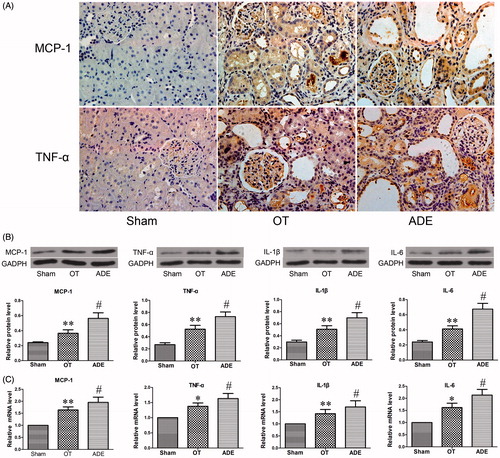
Figure 3. Effect of ozone therapy on TLR4 and p-NF-KB P65 in kidney at week 4. TLR4 and p-NF-KB P65 infiltration were detected by immunohistochemical staining (A). The protein level and mRNA level of TLR4 and the protein level of p-NF-KB P65 were detected by Western blot analysis (B) and Real-time PCR analysis (C). Data were represented by mean ± SEM. **p < 0.01 versus ADE group; #p < 0.01 versus Sham group.
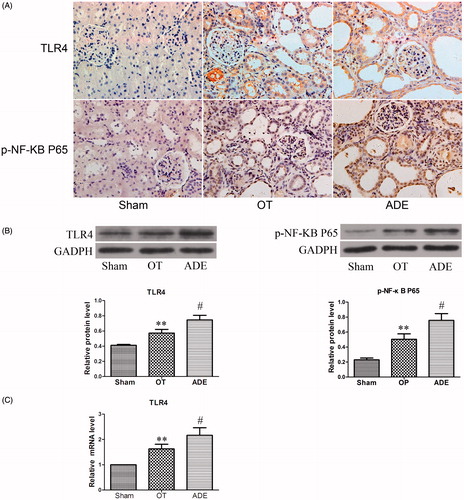
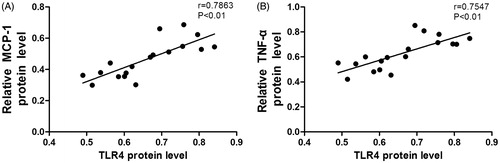
Figure 4. The relationship between the protein level of TLR4 and the protein levels of MCP-1 (A) and TNF-α (B) in the kidney of experiment rats.