Figures & data
Figure 1. (a) Femoral vein prepared for cannulation. Note ligatures loosely applied, ready to be tightened immediately post-cannula insertion. (b) Venotomy made distally and dilated for insertion of cannula. (c) Inulin infusion into cannulated femoral vein, with catheter secured by ligatures and vascular clamp. (d) Microtubing cut using a scalpel blade (top) and scissors (bottom) viewed at high magnification with the operating microscope. Note the ragged edge of the scissor cut tube.
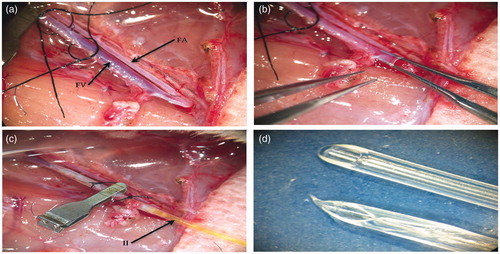
Figure 2. Left-sided renal function after 120 min IRI at 2 and 6 weeks recovery. We observe a severe reduction in GFR (∼50%) after 2 weeks compared to sham operated animals (p = 0.0025). GFR is typically ∼65% of sham values after 6 weeks recovery and is subjected to less variability (p = 0.0012). (Error bars represent SEM.).
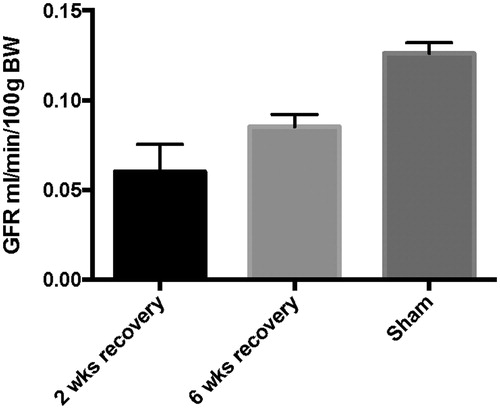
Figure 3. (a) Renal histology from sham operated rat at 2 weeks post-surgery. A glomerulus is marked with an arrow. (b) Histology from rat subjected to 120 min IRI, 2 weeks post-surgery. Note marked tubular dilation (green asterisk) with epithelial thinning and breaks (arrowheads). Also, present are hyaline casts (black dots). A glomeruli with an increased Bowman’s space is marked with an arrow. (c) Histology from rat subjected to 120 min IRI 6 weeks post-surgery. Hyaline casts are noted, but tubular dilation and epithelial thinning are less pronounced. (d) Renal histology from rat subjected to 120 min IRI, 6 weeks post-surgery. The animals were treated with intra-arterial stem-cell based therapy. Histological damage is less marked than with saline treated animals.
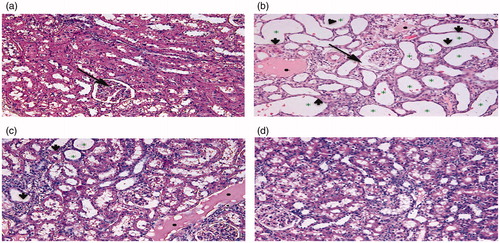
Figure 4. Renal histology shows that after 2 weeks recovery there are significantly more epithelial breaks in rats subjected to 120 min IRI when compared to sham controls (p < 0.0001). Similarly more epithelial cell breaks are observed in the 6 week group than in sham operated animals. (p < 0.0001; Error bars represent SEM.).
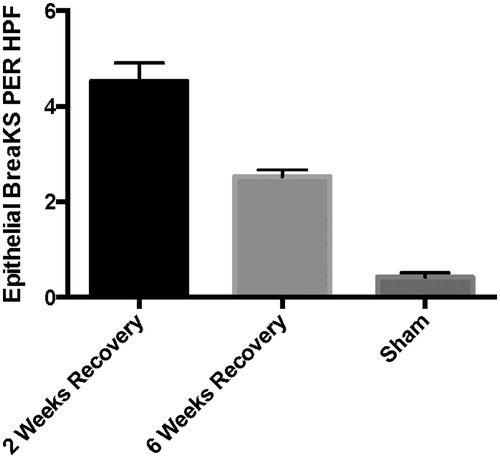
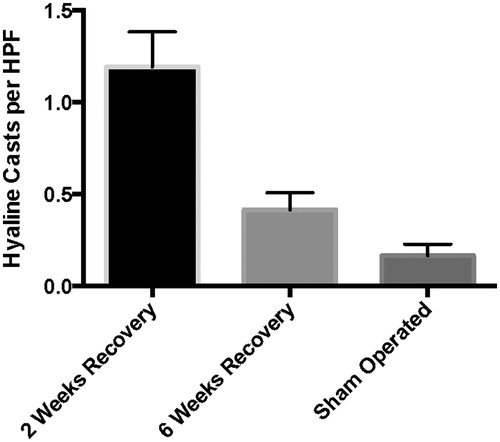
Figure 5. More hyaline casts are observed in both the 2 week recovery group \r\n (p < 0.0001) and the 6 week group (p = 0.0285) when compared to sham operated animals. (Error bars represent SEM.).