
Figures & data
Table 1. General characteristics of the 112 surgical patients included in the analysis.
Table 2. Traditional acid-base and renal parameters according to acute kidney injury status in the early postoperative period.
Figure 1. Differences in serum leukocytes count (A) and C-reactive protein (B) evolution in the first three postoperative days between patients who developed or not AKI during this period. Notes: ICU: intensive care unit. AKI: acute kidney injury. *p < 0.05; **p = 0.01.
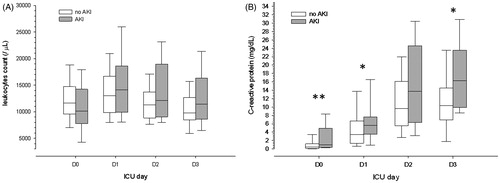
Figure 2. Differences in strong ion gap evolution in the first three postoperative days between patients who developed or not AKI during this period. Notes: ICU: intensive care unit. AKI: acute kidney injury. *p < 0.05; **p < 0.01; ***p < 0.001.
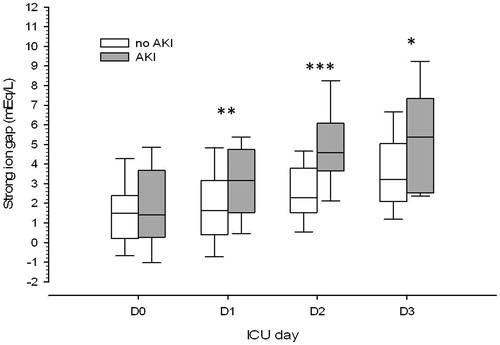
Table 3. Blood physicochemical parameters according to acute kidney injury status in the early postoperative period.
Table 4. Urinary biochemical parameters and indices according to acute kidney injury status in the early postoperative period.
Figure 3. Correlation between serum creatinine and fractional excretion of sodium (A), urea (B) and potassium (C). Horizontal lines represent the usual cutoffs for the fractional excretions (1%, 35% and 10%, respectively); vertical lines represent the cutoff for normal serum creatinine levels (considered less than 1.2 mg/dL). The gray zone highlights the almost absence of samples with increased serum creatinine and simultaneous normal fractional excretion of potassium.
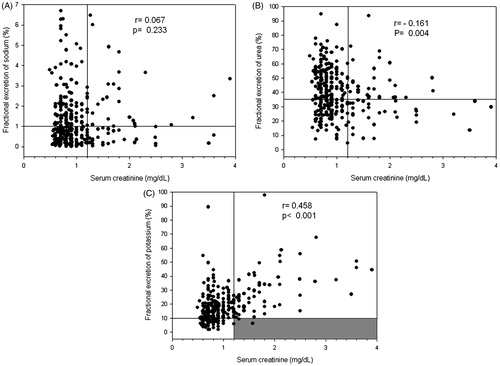
Table 5. Diagnostic accuracy, sensitivity, specificity, positive and negative predictive values for AKI diagnosis in the early postoperative period of distinct urinary and blood parameters measured at ICU admission.