Figures & data
Figure 1. Flow cytometry analysis of bone-marrow, with a CD45 PerCP staining.
Analytic strategy: 1) size and structure of cells 2) inclusion of single cells comparing the height and area of the Hoechst signal (excitation by a violet laser at 405 nm and detection through a 450/50 nm filter) 3) inclusion of cells having a correct Hoechst signal (excitation by a violet laser at 405 nm and detection through a 425–475 nm filter) quantitative search for CD45+ cells in the PerCP channel (excitation by a laser at 488 nm and detection through a 655–730 nm filter).
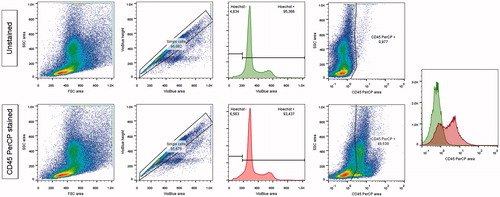
Figure 2. Experimental protocol.
To rescue mice from cisplatin-induced acute kidney injury, 106 BMDC were injected on day 3 post cisplatin injection. Two control groups were used: one received 10Citation6 renal cells and the other received the same volume of normal saline. Survival was observed over 10 days, and then any survivors were sacrificed for organ study.
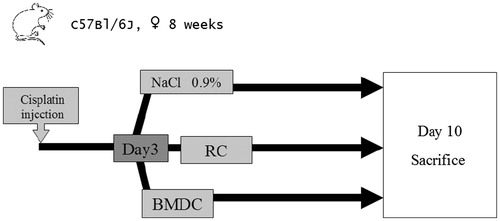
Table 1. Primers used for qRT-PCR (mRNA strand sequences).
Figure 3. Lethality and severity of AKI following cisplatin injection.
A. Survival curve after the injection of increasing doses of cisplatin. B. Plasma creatinine and urea were increased three days after the injection of cisplatin (20 mg/kg). C. Mean percentage of injured tubules and corresponding histological damage scores at day 3. Masson's trichrome staining (D), periodic acid-Schiff staining (E), hematoxylin and eosin staining (F), showing the renal cortex of a mouse injected with saline (left) and that of a mouse injected with 20 mg/kg of cisplatin (right): tubular dilation, loss of brush border, the presence of intra-luminal casts and loss of the epithelial border were typical features of AKI. G. Detection of apoptotic cells using the TUNEL (TdT-mediated X-dUTP nick end labeling) assay. H. Detection of proliferating cells (Ki-67+) by immunohistochemistry. All photographs were taken after optical miscroscopy at ×400 magnification of the renal cortex.
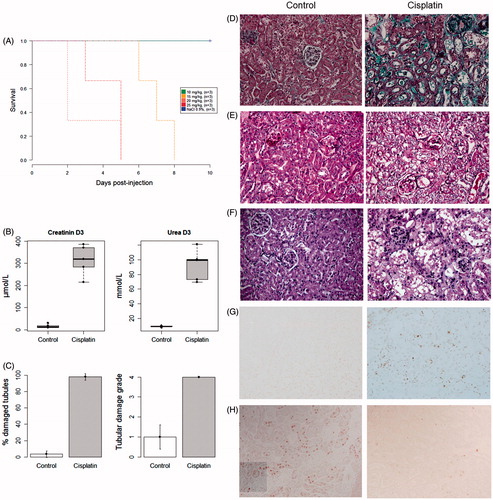
Figure 4. Kaplan–Meier curve of mouse survival after cell rescue therapy.
Injection of 106 BMDC, 106 renal cells or of an equal volume of normal saline was performed three days after cisplatin injection. No difference in survival was found between the groups (log rank test, p = 0.369).
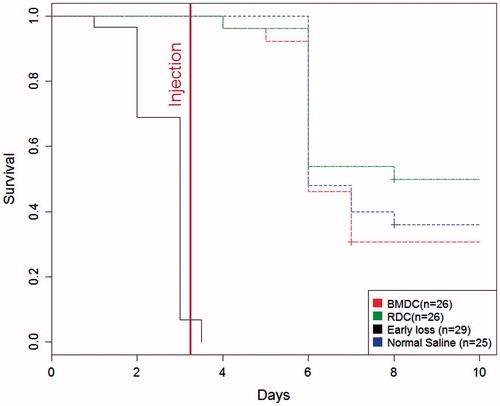
Figure 5. Histology of kidneys from mice which survived for 10 days after the rescue cell injection.
Analysis shows similar tubular injury with some degree of regeneration and similar interstitial fibrosis.
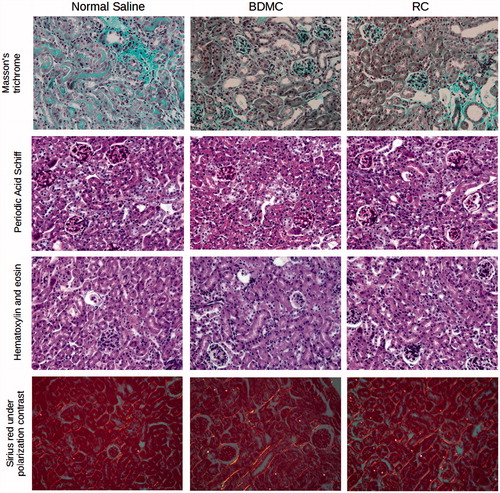
Figure 6. Renal functional parameters in surviving animals.
No difference in renal functional parameters was found between groups at day 10 in surviving animals (p = 0.949 for plasma creatinine and p = 0.368 for plasma urea).
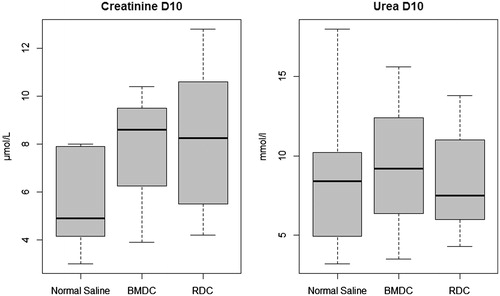
Figure 7. IGF1 messenger RNA real-time PCR.
No difference was found in IGF-1 transcripts among groups in the kidneys of mice that survived for 10 days.
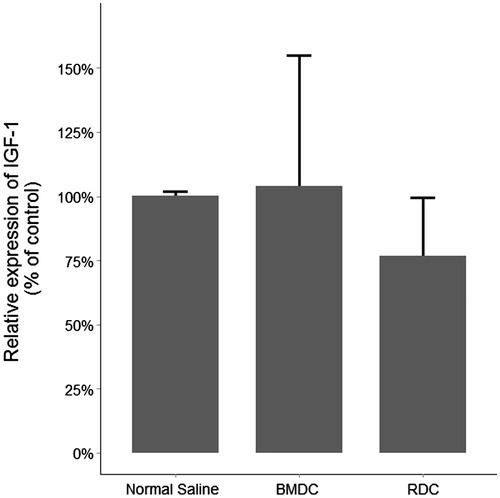
Table 2. Detection of labeled cells in recipient surviving mice by flow cytometry. Results are expressed as medians [Q1; Q3]. (*: BMDC vs. renal cells).
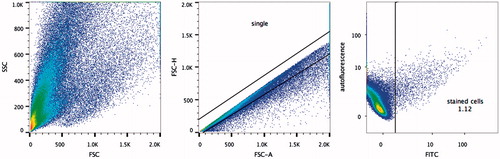
Figure 8. Flow cytometry analysis of renal cells homing to injured kidneys.
Analytic strategy: 1) inclusion of cell populations that were within the acceptable limits of size and structure; 2) exclusion of duplicates or aggregates by comparing the height and area of the signal; 3) self-fluorescent cells were excluded by gating non-fluorescent cells in the VioGreen channel (excitation by a violet laser at 405 nm and detection through a 525/550 filter); quantitative search for EGFP + cells in the FITC channel (excitation by a blue laser at 488 nm and detection through a 525/550 nm filter).