
Figures & data
Figure 1. Genotyping for the BsmI, ApaI, and TaqI polymorphims in the VDR gene. (A) Representative gel showing the genotype for BsmI. The first lane of gel contains a 50 bp DNA ladder. (B) Representative gel showing the genotype for ApaI. The first lane of gel contains a 100 bp DNA ladder. (C) Representative gel showing the genotype for TaqI. The first lane of gel contains a 100 bp DNA ladder.
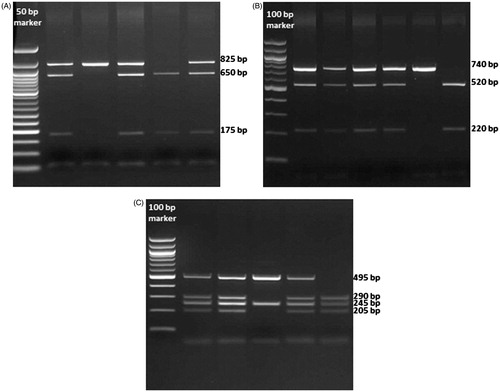
Table 1. Primer sequences in VDR gene polymorphisms.
Table 2. Demographic and anthropometric features of the study and control groups.
Table 3. The clinical characteristics of the infants with urolithiasis.
Table 4. Serum and urine metabolic markers of the stone-forming children and controls.
Table 5. Comparision of the VDR BsmI, ApaI, and TaqI genotype distributions between the stone forming children and the controls.
Table 6. Comparison of the VDR BsmI, ApaI, and, TaqI genotype distributions between the hypercalciuric and normocalciuric stone formers.