Figures & data
Table 1. Urinary protein excretion and biochemical parameters of blood measurement of rats.
Figure 1. TAC delayed glomerular sclerosis and tubular fibrosis in 5/6 nephrectomized rats. Then, renal sections were detected by light microscopy after Masson staining (original magnification: ×100). (A) Normal renal cortex. (B) In 5/6 nephrectomized rats, glomeruli showed obviously mesangial expansion and glomerular sclerosis, as well as interstitial fibrosis and tubular atrophy. (C) In TAC treated rats, the range of glomerular sclerosis and interstitial fibrosis was significantly less than the model group, tubular atrophy was also alleviated. (D) Glomerular sclerosis index and tubulointerstitial fibrosis score were significantly increased in the model group, which were obviously decreased by TAC. *p < 0.05 versus sham-operated rats, #p < 0.05 versus 5/6 nephrectomized rats.
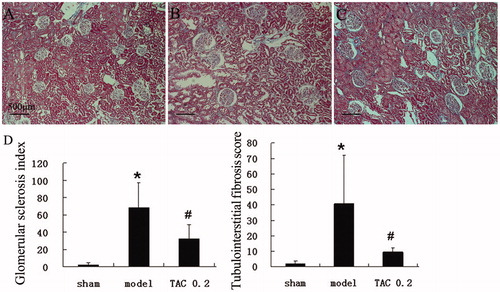
Figure 2. TAC restored podocyte process damage in 5/6 nephrectomized rats (original magnification: ×13,500). (A) Sham-operated rats showed a “zipper-like” appearance, foot processes from the cell body of podocytes regularly attached to the GBM. (B) Widespread of podocyte foot processes fusion was found in rats at 8 weeks after 5/6 nephrectomy. (C) TAC significantly prevented the fusion of podocyte foot process and maintained the “zipper-like” appearance.
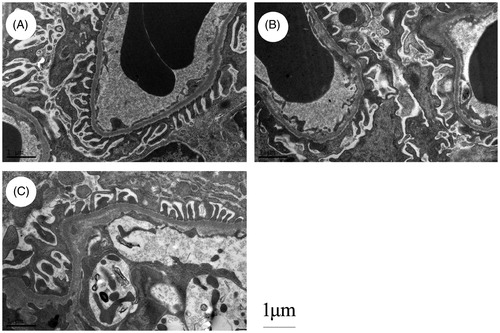
Figure 3. TAC stabilized the distribution of Cabin1 in 5/6 nephrectomized rats (original magnification: ×400). (A–C) In sham-operated rats, Cabin1 was mainly localized in glomerular innate cells and partly overlap with WT-1 in the nuclei of podocytes. (D and E) In 5/6 nephrectomized rats, the overlap of Cabin1 and WT-1 in podocyte nuclei was much more obvious than sham-operated rats. (G–I) In TAC treated rats, the distribution of Cabin1 in podocyte nuclei maintained to the original pattern of sham-operated rats.
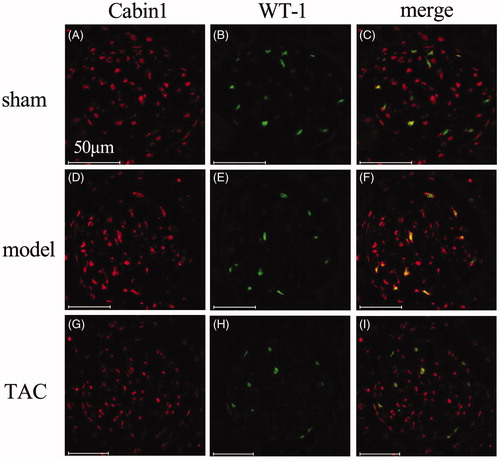
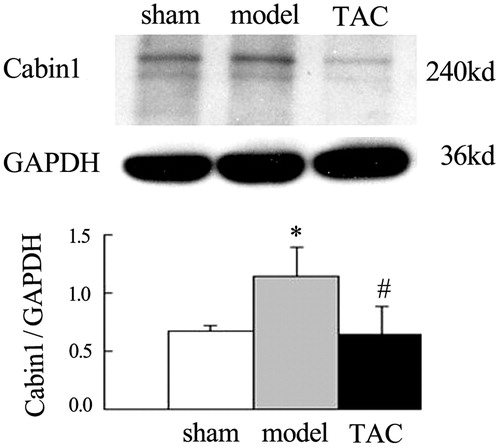
Figure 4. TAC decreased the elevation of Cabin1 protein expression in the renal cortex of nephrectomized rats. The abundance of Cabin1 in renal cortex was determined by western blot. Western blot analysis showed that relatively low level protein expression of Cabin1 in sham-operated rats. However, Cabin1 protein levels were obviously increased at 8 weeks after operation in 5/6 nephrectomized rats. While compared with the model group, treated by TAC for 4 weeks significantly decreased the elevation protein expression of Cabin1. *p < 0.05 versus sham-operated rats, #p < 0.05 versus 5/6 nephrectomized rats.