Figures & data
Table 1. Sequences of primers and ID numbers of UPL probes used for qRT-PCR.
Table 2. Body weight and blood glucose at beginning and end of the experiment.
Table 3. Kidney weight and apoptotic index of rats.
Figure 1. Light microscopy of kidney tissues is seen in different groups. (A) In controls, normal kidney architecture is observed. (B) Group D, transparent tubules (*) are detected. (C) Group D, dilatation in distal tubules (*) and epithelial desquamation into the lumen of tubules (arrow) are seen. (D) Group D + PI, transparent tubules (*) are exhibited. (E) Group D + PII, transparent tubules (*) are shown. (F) Group P, normal kidney architecture is observed. Kidney cross sections were stained with Masson’s Trichome.
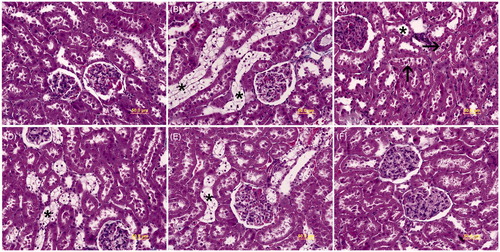
Figure 2. Immunohistochemical localization and histoscore of neuronal, inducible and endothelial NOS expression of the kidney tissue are seen in the different groups (A) Group C, (B) Group D, (C) Group D + PI, (D) Group D + PII, (E) Group P, and (F) Negative controls.
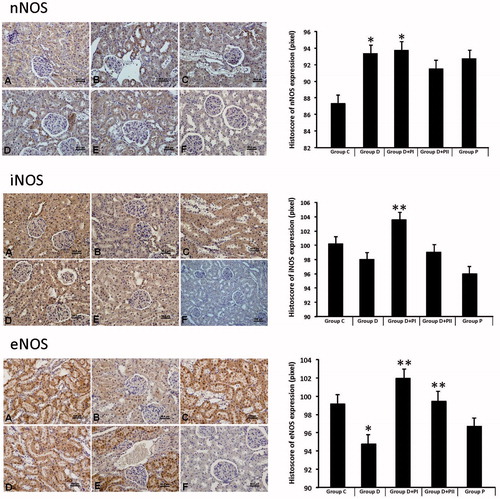
Figure 3. TUNEL staining of kidney tissues are seen. (A) Group C, (B) Group D, (C) Group D + PI, (D) Group D + PII, (E) Group P and (F) Negative controls. TUNEL-positive cells (arrow) are mainly observed in the cells of distal tubules.
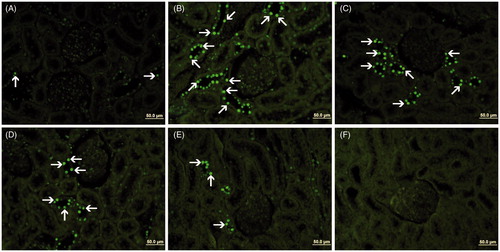
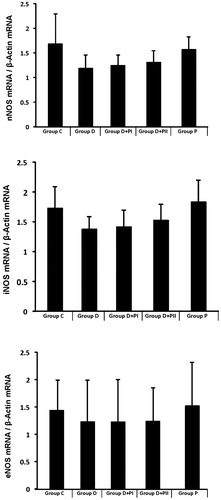
Figure 4. Neuronal, inducible and endothelial NOS mRNA/β-Actin mRNA levels of the kidney tissue are seen in the different groups.