Figures & data
Figure 1. Effects of metformin modification on renal function. (A) Effects of metformin on the serum BUN concentrations after 45 min of ischemia followed by 12 weeks of reperfusion. (B) Effects of metformin on the serum Cr concentrations after 45 min of ischemia followed by 12 weeks of reperfusion (*p < 0.05 versus the sham group, #p < 0.05 versus the IRI group. n = 5).
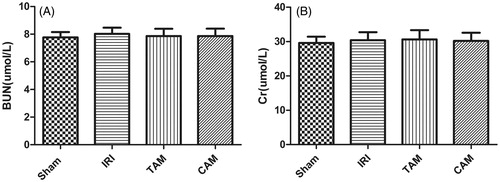
Figure 2. Metformin attenuated tissue damage, fibrogenic development, and TGF-β1 expression during I/R. (A, E, and I) Section from sham-operated rat, (B, F, and J) section from rat subjected to IRI, (C, G, and K) section from rat subjected to transient administration of metformin. (D, H, and L) section from rat subjected to continuous administration of metformin. (A–D) H&E staining. (E–H) Masson’s trichrome staining. (I–L) TGF-β1 immunohistochemical staining. All H&E, Masson’s trichrome staining and immunohistochemical staining, original magnification ×400. (M) Quantitative analysis of tubulointerstitial fibrosis. (N) Quantification of TGF-β1-positive cells. (*p < 0.05 versus the sham group, #p < 0.05 versus the IRI group. n = 5).
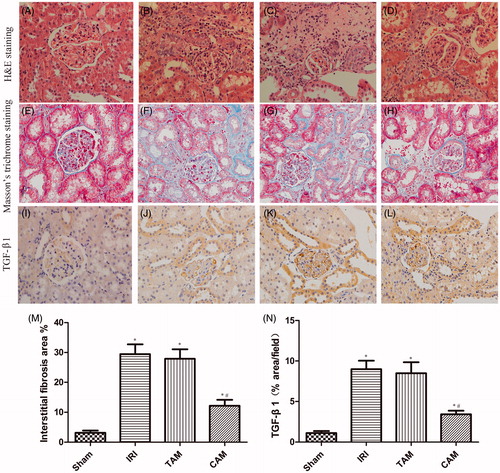
Figure 3. Effects of metformin on TNF-α, IL-6, TGF-β1, α-SMA, Vimentin, and E-cadherin expressions in the kidney after 45 min of ischemia followed by 12 weeks of reperfusion. (A) Representative Western blots showing the effects of metformin on TNF-α, IL-6, and TGF-β1, (B) representative Western blots showing the effects of metformin on α-SMA, Vimentin, and E-cadherin. (C) Relative band densities of TNF-α to the mean value of the control, (D) relative band densities of IL-6 to the mean value of the control, (E) relative band densities of TGF-β1 to the mean value of the control, (F) relative band densities of α-SMA to the mean value of the control, (G) relative band densities of Vimentin to the mean value of the control, (H) relative band densities of E-cadherin to the mean value of the control (*p < 0.05 versus the sham group, #p < 0.05 versus the IRI group. n = 5).
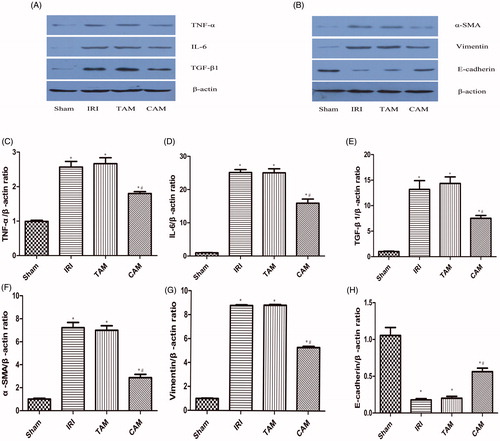
Figure 4. Effects of metformin on p-AMPK and T-AMPK expressions in the kidney after 45 min of ischemia followed by 12 weeks of reperfusion. (A) Representative Western blots showing the effects of metformin on p-AMPK and T-AMPK, (B) relative band densities of p-AMPK to the mean value of the control, (C) relative band densities of T-AMPK to the mean value of the control (*p < 0.05 versus the sham group, #p < 0.05 versus the IRI group. n = 5).
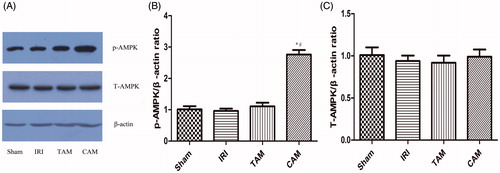
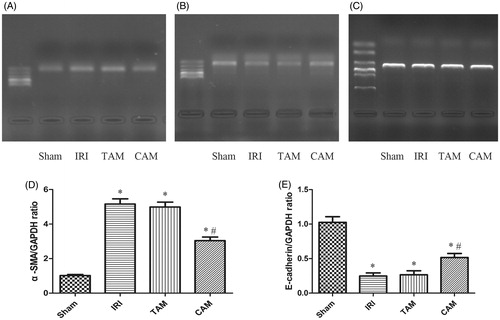
Figure 5. The mRNA level of α-SMA and E-cadherin in the kidney. (A) Effects of metformin on the mRNA level of α-SMA after 45 min of ischemia followed by 12 weeks of reperfusion. (B) Effects of metformin on the mRNA level of E-cadherin after 45 min of ischemia followed by 12 weeks of reperfusion. (C) The mRNA level of GAPDH after 45 min of ischemia followed by 12 weeks of reperfusion. (D) Relative band densities of α-SMA to the mean value of the control. (E) Relative band densities of E-cadherin to the mean value of the control (*p < 0.05 versus the sham group, #p < 0.05 versus the IRI group. n = 5).