
Figures & data
Table 1. Basic demographic details of patients with BCF and BBF. Results are presented as a mean ± SEM or percentage of the total population.
Table 2. Operative details for creation of BBF and BCF. Results are presented as a percentage of the total population.
Figure 1. Primary patency.
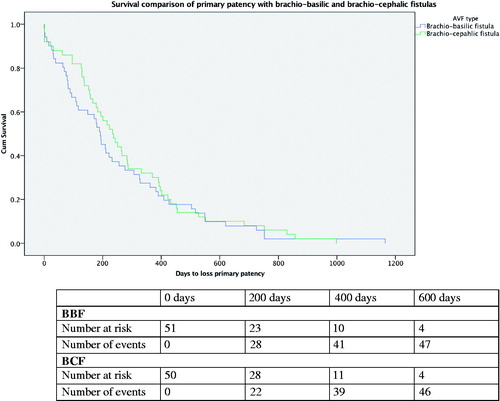
Figure 2. Primary-assisted patency.
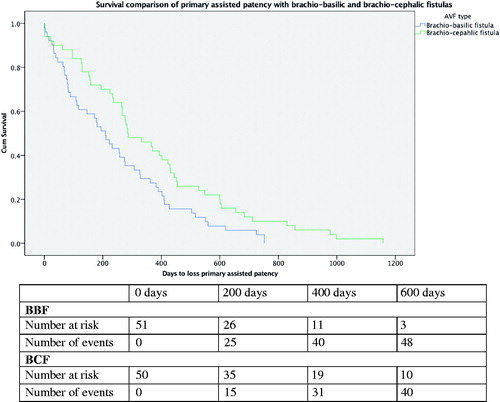
Figure 3. Secondary patency.
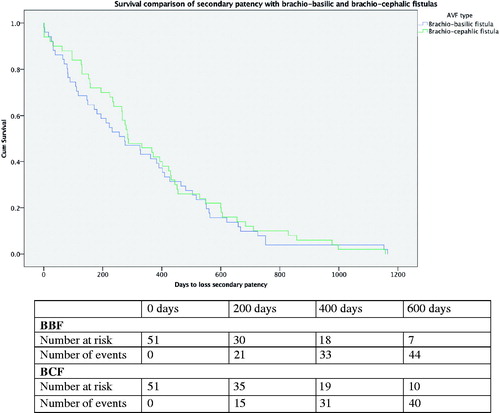
Table 3. A comparison of primary-assisted patency, primary functional patency and secondary patency between the BBF and BCF cohort.
Table 4. Comparison of the number of interventional procedures performed in an attempt to maintain access patency between BCF and BBF.