
Figures & data
Table 1. A summary of clinical data of the patients.
Figure 1. Serum creatinine values (mean and SD) at five time-points: before surgery, at the end of CPB and 2, 24, and 48 h after the end of CPB.
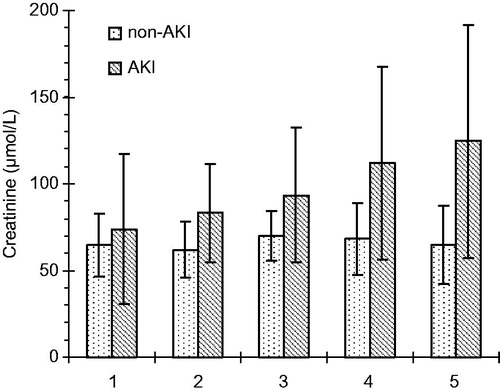
Table 2. Serum creatinine levels (μmol/L) in AKI and non-AKI groups at different points.
Figure 2. Serum CysC values (mean and SD) at five time-points: before surgery, at the end of CPB and 2, 24, and 48 h after the end of CPB.
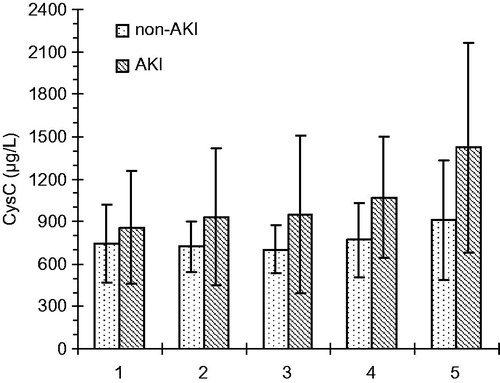
Table 3. Serum CysC levels (μg/L) in AKI and non-AKI groups at different points.
Figure 3. Serum CYR61 values (median and interquartile ranges) at five time-points: before surgery, at the end of CPB and 2, 24, and 48 h after the end of CPB.
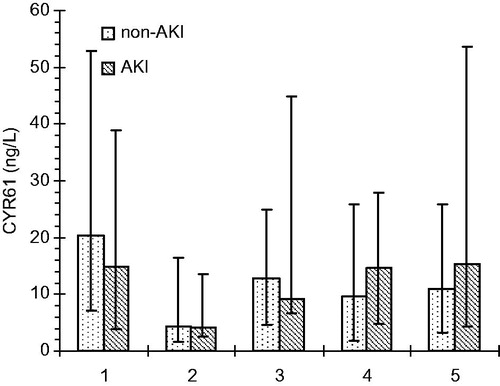
Figure 4. The correlation (r = −0.465; p < 0.01) between serum CYR61 levels (μg/L) 48 h after the end of CPB and age of the patients (years).
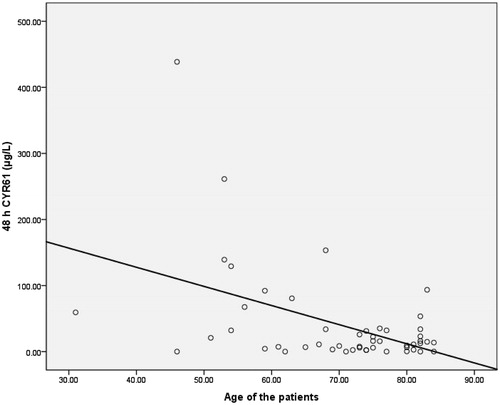
Figure 5. ROC curve for serum creatinine, CysC and CYR61 values 2 h after the end of CPB.
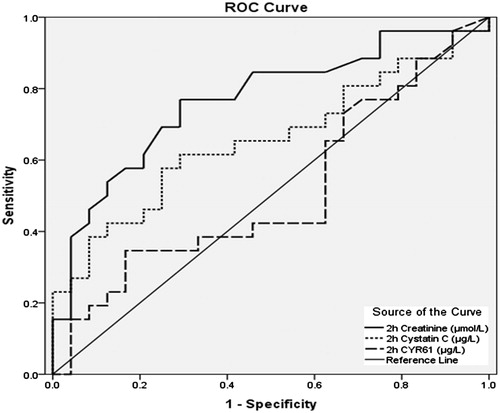
Table 4. Serum CYR61 levels (μg/L) in AKI and non-AKI groups at different points.