
Figures & data
Table 1. Demographic features of all patients and IL18–607/–137 gene polymorphism groups.
Table 2. Frequency of alleles and genotypes of interleukin-18 gene promoter polymorphism in kidney recipients.
Figure 1. The oxidative stress parameters before and after transplantation at day 7 and month 1. Data are given as mean ± standard error.
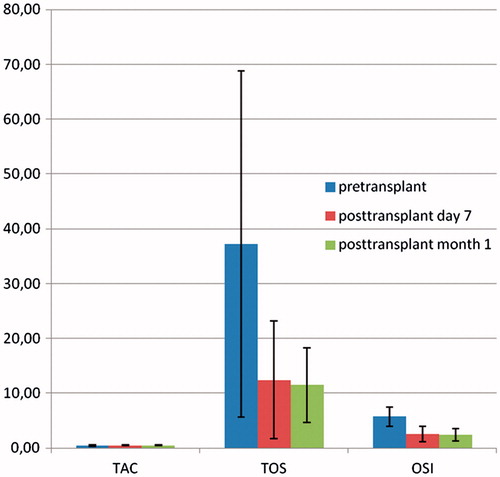
Table 3. Serum creatinine, cystatin-C, CRP, IL-18, TAC, TOS levels, OSI, and eGFR values before and after transplantation at day 7 and month 1. Data are given as mean ± standard error.