Figures & data
Figure 1. Autophagy in HK-2 cells during in vitro I/R and the cell viability after 3-MA treatment. (A) LC3-II expression was determined by Western blotting for different ischemic time. (B) LC3-II levels for different reperfusion time. (CV) Quantification of LC3-II levels in (A). (D) Quantification of LC3-II levels in (B). (E) The GFP-LC3 puncta formation in HK-2 cells was determined by immune fluorescence in ischemia and I/R. (F) LC3-II expression after HK-2 cells were treated by 3-MA in ischemic step. (G) LC3-II expression after HK-2 cells were treated by 3-MA in I/R. (H) The cell viability in ischemic condition after treated by 3-MA. (I) The cell viability after HK-2 cells were treated by I/R and 3-MA. In (C), (D), (H), and (I), data are presented as the means ± SDs in three independent experiments. *p < 0.05 as compared with the control and I1/R0 group. In (H) and (I), **p < 0.05 as compared with the group without 3-MA treated.
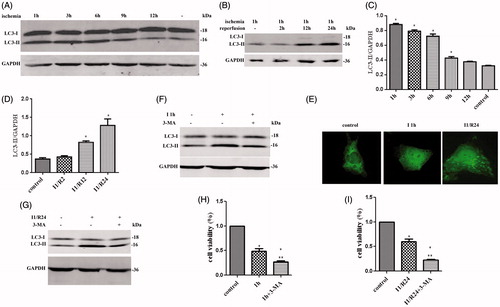
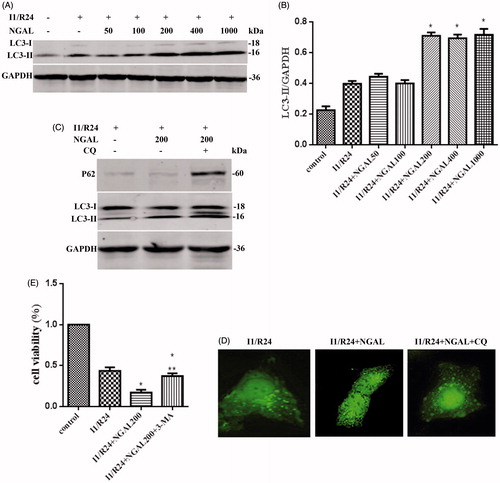
Figure 2. NGAL can further strengthened autophagy flux and aggravate cell injury. (A) LC3-II levels for different concentration NGAL. (B) Quantification of LC3-II levels in (A). (C) P62 and LC3-II levels after NGAL and CQ treated. (D) The GFP-LC3 puncta formation in HK-2 cells after I/R and NGAL treated. After CQ applied, the autophagosome accumulated to green lump. (E) The cell viability after NGAL and 3-MA treated. In (B) and (E), data are presented as the means ± SDs in three independent experiments. *p < 0.05 as compared with the control and I/R group. In (E), **p < 0.05 as compared with the group which without 3-MA treated.