Figures & data
Table 1. Phenolic compounds of propolis extract.
Figure 1. Light microscopy of kidney tissue in different groups was observed. (A) In Group 1, normal kidney architecture was shown. (B) In group 2, epithelial desquamation into the lumen of the tubules (arrow), and dilatation and congestion of the peritubular vessels (*) were visualized. (C) In group 3, normal kidney architecture was observed. (D) In group 4, normal kidney architecture was exhibited. Kidney cross sections were stained with H&E.
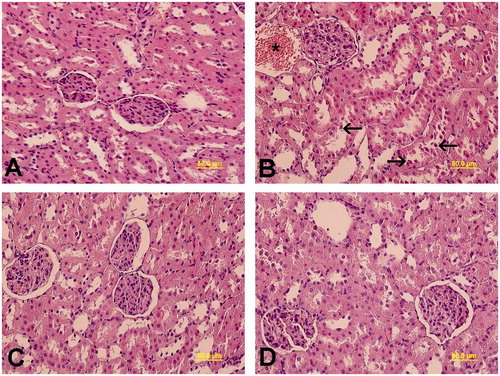
Figure 2. TUNEL staining of kidney tissue. TUNEL-positive cells (arrow) were mainly observed in distal tubule. (A) Group 1, (B) group 2, (C) group 3, and (D) group 4.
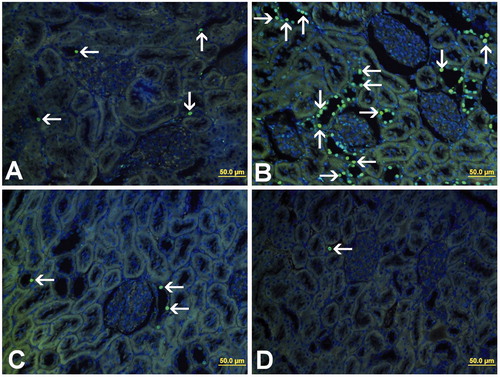
Table 2. Apoptotic index and HSP-70 expression of rats. Values are expressed as mean ± SE.
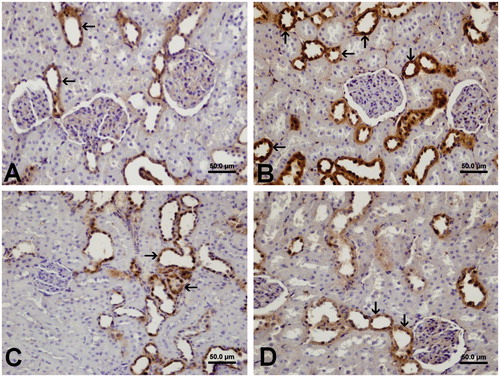
Figure 3. Immunohistochemical localization of HSP-70 expression of the kidney tissue in the different groups. (A) Expression of HSP-70 was prominent in the distal tubules and collecting ducts in group 1. (B) Increased expression of HSP-70 was shown in the distal tubules and collecting ducts in group 2. (C) HSP-70 immunostaining was observed in the distal tubules and collecting ducts in group 3. (D) HSP-70 expression was shown in the distal tubules and collecting ducts in group 4.