Figures & data
Table 1. Renal function parameters in the four treatment groups (n = 8 each).
Table 2. Oxidative stress biomarkers of four treatment groups (n = 8 each).
Figure 1. Renal histology of the study groups (haematoxylin and eosin staining, original magnification, x400). Normal histology in (a) control and (c) paricalcitol groups. (b) Tubular necrosis areas and proteinaceous casts of Group A. (d) Healthy tubular cells of Group A + P.
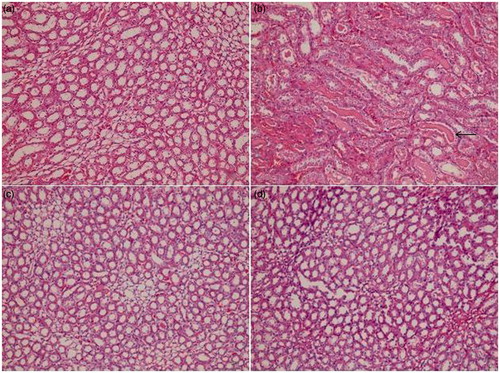
Table 3. Histology and immunohistochemistry in the four treatment groups (n = 8 each).
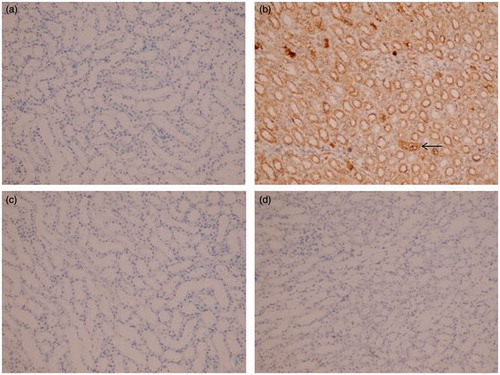
Figure 2. Immunoexpression of VEGF in the four treatment groups (X400). No VEGF expression in the renal tubular cells in the (a) control, (c) paricalcitol and (d) paricalcitol treated amikacin-induced nephrotoxicity groups. (b) Intense expression of VEGF of amikacin-induced nephrotoxicity group.