
Figures & data
Table 1. Demographic profile of study patients.
Figure 1. Representative photograph of ACE gene in HT patients with and without CKD. Lanes 1, 4, and 5: heterozygous ID samples (190 bp and 490 bp). Lanes 2 and 3: homozygous DD sample (190 bp). Lane 6: DNA ladder 50–500 bp (Hind III digest Ladder).
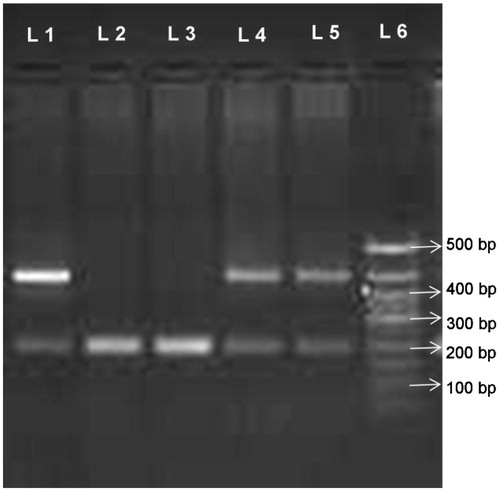
Table 2. Distribution of ACE genotype in the two groups.
Table 3. Laboratory characteristics of patients with respect to ACE gene genotype.