
Figures & data
Table 1. The basic anthropometric data and filtration markers for all children and subgroups at different CKD stages, based on GFRI results (mean value ± SD).
Table 2. p Values for comparisons between analyzed groups.
Table 3. The diseases category in examined group (n = 353).
Table 4. The employed formulas description.
Figure 1a. The correlation between GFRI and tested eGFR. The GFRI value – on horizontal axis. On the vertical axes tested eGFR according to original equations: (GFRScr, GFRScrBS, GFRF, GFRZ, GFRS3M, respectively). The slash line is presenting the difference ± 30% to GFRI. The horizontal and vertical lines on plots mean values: 60 and 90 mL/min/1.73 m2.
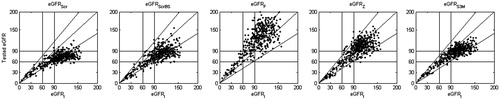
Figure 1b. The relative error (RE) plots [100% × (eGFRX-GFRI)/GFRI]. The GFRI value (in mL/min/1.73 m2) is presented on horizontal axis. The RE values [%] are shown on vertical axes. The vertical lines on plots mean values 60 and 90, the horizontal lines on plots show values −30% and +30% of RE.
![Figure 1b. The relative error (RE) plots [100% × (eGFRX-GFRI)/GFRI]. The GFRI value (in mL/min/1.73 m2) is presented on horizontal axis. The RE values [%] are shown on vertical axes. The vertical lines on plots mean values 60 and 90, the horizontal lines on plots show values −30% and +30% of RE.](/cms/asset/bb81e55e-b553-478a-9492-89fe29d3c8b4/irnf_a_1163152_f0002_b.jpg)
Figure 2a. The correlation between GFRI and modified Schwartz equations. The GFRI value is presented on horizontal axis. On the vertical axes corrected eGFR: (GFRScrT, GFRScrC, GFRScrBST, GFRScrBSC, GFRScrBST GFRS3MT, GFRS3MC, respectively). The GFR in mL/min/1.73 m2. The horizontal and vertical lines on plots mean values: 60 and 90 mL/min/1.73 m2.
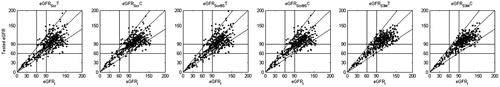
Figure 2b. The relative error (RE) plots [100% × (eGFRX-GFRI)/GFRI] on horizontal axis. The RE values [%] – on vertical axes. GFRx – corrected Schwartz equations corresponding to . The vertical lines on plots mean values 60 and 90 mL/min/1.73 m2, the horizontal lines on plots show values −30% and +30% of RE.
![Figure 2b. The relative error (RE) plots [100% × (eGFRX-GFRI)/GFRI] on horizontal axis. The RE values [%] – on vertical axes. GFRx – corrected Schwartz equations corresponding to Figure 2a. The vertical lines on plots mean values 60 and 90 mL/min/1.73 m2, the horizontal lines on plots show values −30% and +30% of RE.](/cms/asset/15642ac0-4fa8-4afb-bc41-29c86950c94a/irnf_a_1163152_f0004_b.jpg)
Table 5. GFRScr versus GFRI (corresponding to ).
Table 6. GFRScrT versus GFRI (corresponding to ).
Table 7. GFRScrC versus GFRI (corresponding to ).
Table 8. GFRScrBS versus GFRI (corresponding to ).
Table 9. GFRScrBST versus GFRI (corresponding to ).
Table 10. GFRScrBSC versus GFRI (corresponding to ).
Table 11. GFRS3M versus GFRI (corresponding to Figure 1a).
Table 12. GFRS3MT versus GFRI (corresponding to ).
Table 13. GFRS3MC versus GFRI (corresponding to ).
Table 14. The classification accuracy (CA) coefficients calculated according to EquationEq. (7)(6) for 9-field tables.
Table 15. The eGFR value, RE value, RE centiles, RMSRE, R (with p value) and 10 and 30% of accuracy to GFRI in patients with GFRI < 60 mL/min/1.73 m2 (N = 52).
Table 16. The eGFR value, RE value, RE centiles, RMSRE, R (p value) and 10 and 30% of accuracy to GFRI for original and corrected equations for GFRI < 60–90 mL/min/1.73 m2 (N = 85).
Table 17. The eGFR value, RE, RE centiles, RMSRE, R (p value) and 10 and 30% of accuracy to GFRI in for GFRI 90–135 mL/min/1.73 m2 (N = 238).
Table 18. The eGFR value, RE, RE centiles, RMSRE, R (p value) and 10 and 30% of accuracy to GFRI for GFRI ≥135 mL/min/1.73 m2 (N = 42).
Table 19. Determined coefficients a.
Table 20. Original and corrected [C] coefficients for the tri-marker Schwartz equation of 2012.
Table 21. Original and corrected [C] coefficients for the Schwartz equation of 2012.
Table 22. Original and corrected [C] coefficients for the Schwartz bed-side formula of 2009.
Table 23. The eGFR value (mean ± SD), average relative error (RE), the 5, 50, 95 centiles of RE (50% centile equals median value), RMSRE, correlation coefficient (R) to iohexol method ( p value) and 10% and 30% accuracy in all patients (N = 417).