
Figures & data
Figure 1. Photomicrographs of cFSGS show (a) global collapse of glomerular tuft wish hyperplasic and hypertrophied podocytes with overlying hypertrophied and hyperplastic podocytes (b) Hyperplastic podocytes (Ki 67 positive inset) over segmental collapsed tuft show mitosis, moderate cytoplasm with protein absorption droplets and prominent nucleoli (c) Segmental collapse with collagenized glomerular tuft having a crown of quiescent podocytes (d) Global collapse lined by row of cuboidal podocytes without mitosis and protein absorption droplets (PAS- Silver Methenamine stain a, c–d, Masson’s Trichrome-b, Immunohistochemistry Ki 67-insetd, a–c, X 40, d-X 20 original magnification).
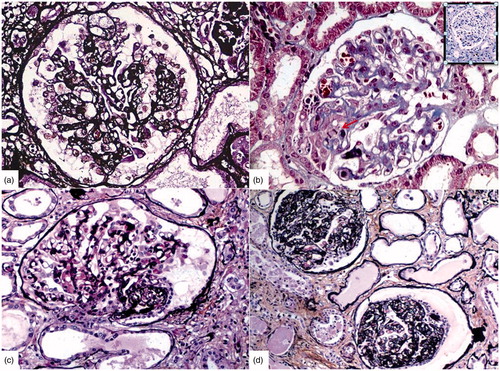
Table 1. Comparison of clinical and pathological parameters of cFSGS and steroid and tacrolimus resistant FSGS.
Table 2. Brief summary of all the patients with cFSGS.