
Figures & data
Figure 1. The distribution of MCs in patients with anti-GBM nephritis: immunohistochemical (IH) staining showing tryptase expression in the kidney of normal control (A), patients with anti-GBM nephritis in group 1 (B) and in group 2 (C) (IH, 200×).
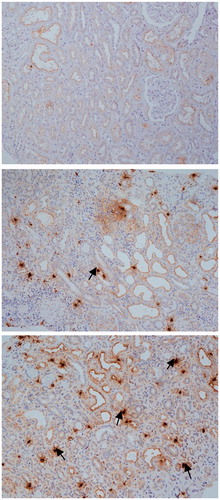
Figure 2. The distribution of MCs in patients with anti-GBM nephritis: immunohistochemical (IH) staining showing CD117 expression in the kidney of patients with anti-GBM nephritis in group 1 (A) and in group 2 (B) (IH, 200×).
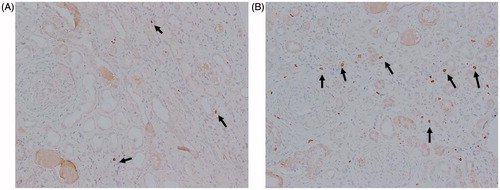
Figure 3. Renal pathology for hematoxylin–eosin, periodic acid-Schiff’s reagent, periodic acid methenamine, and Masson’s trichrome staining of patients in group 1 (A–C) and group 2 (D–F) (200×): it could be seen from the contrasts of pathology of the two groups that the patients in group 2 had more chronic lesion such as more serious degree of fibrosis and more inflammatory cell infiltration.
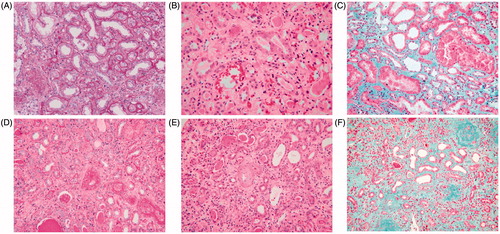
Table 1. General conditions and clinical features between two groups.
Table 2. Laboratory data between two groups.
Table 3. Data of histopathology between two groups.
Table 4. The histopathologic types between two groups.
Table 5. The number of MC in different type of histopathology.
Table 6. Correlations between MCs with clinic pathological characteristics.
Table 7. The eGFR changes among the histopathologic types and between two groups.