Figures & data
Figure 1. OMT ameliorates renal injury and interstitial matrix disposition in UUO at 7 days after surgery. (A) Representative micrographs of HE staining, immunohistochemical staining for COI-1 and FN expression, and original magnification ×200. (B, C) Quantitative analysis of FN and COI-1 for immunohistochemistry staining. (D, E) mRNA levels of COL-1 and FN in the different treated groups. +p < 0.01 versus sham group, *p < 0.01 versus UUO with vehicle-treated group. (Scale bars: 200 μm).
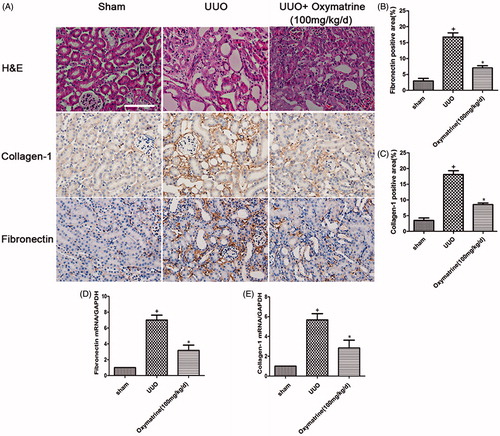
Figure 2. OMT suppresses activation of myofibroblasts in obstructed kidneys. (A) Western blot analysis for vimentin and α-SMA in different treatment groups. (B, C) Statistical analysis of relative expression of vimentin and α-SMA. (D, E) mRNA levels of vimentin and α-SMA in the different treated groups. +p < 0.01 versus sham group. *p < 0.05 versus UUO with vehicle-treated group.
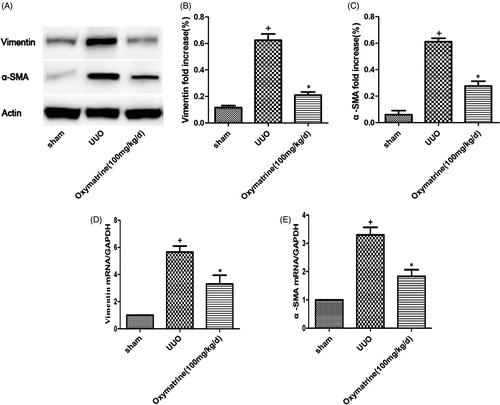
Figure 3. OMT reduced the release of proinflammatory cytokines IL-1β, IL-6, and TNF-α at 7 days after UUO. Real-time PCR analysis for mRNA levels of IL-1β, IL-6, and TNF-α. +p < 0.01 versus sham group. *p < 0.05 versus UUO with vehicle-treated group.
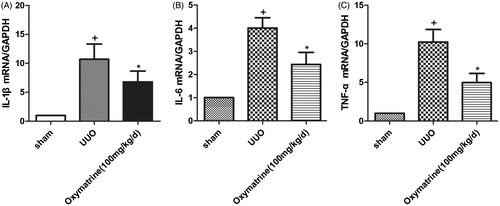
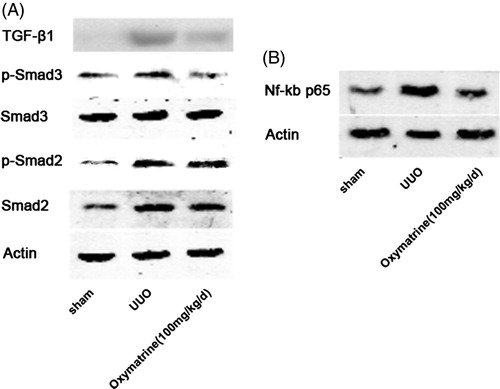
Figure 4. OMT suppresses activation of the TGF-β1/Smad3 and NF-κB signal pathways after UUO. (A) Western blot analysis for protein expression of TGF-β1, pSmad3, Smad3, pSmad2, and Smad2 in obstructed kidneys. (B) Protein expression of NF-κB p65 in kidneys was analyzed by Western blot.