Figures & data
Table 1. The serum and kidney levels of IL-33, IL-6, and IL-1β of groups.
Figure 1. Photomicrographs of rat kidney (H&E, 200×). (A) HRs with normal histological appearance, (B) DRs, and (C) DRs + CN. Degenerative changes in tubuli (*) and glomeruli (arrowhead).
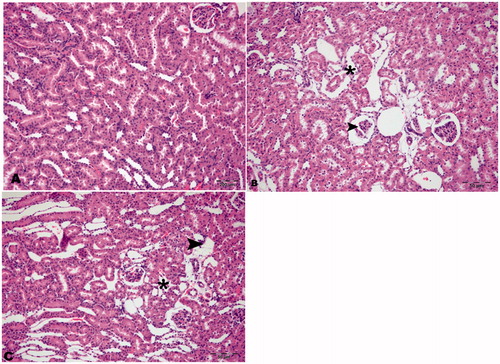
Figure 2. Immunohistochemical staining of IL-33 in rat kidney (200×). (A) HRs showed no immunopositivity, (B) DRs showed moderate immunopositivity in tubular cells (arrowhead), and (C) DRs + CN showed severe immunopositivity in tubular cells for IL-33 (arrowhead).

Table 2. Immunohistochemical staining of markers of inflammation, apoptosis, and autophagy in groups.
Figure 3. Immunohistochemical staining of cleaved caspase-3 in rat kidney (200×). (A) HRs showed no immunopositivity, (B) DRs showed moderate immunopositivity in tubular cells (arrowhead) and glomeruli (arrow), and (C) DRs + CN showed severe immunopositivity for cleaved caspase-3 in tubular cells (arrowhead) and glomeruli (arrow).
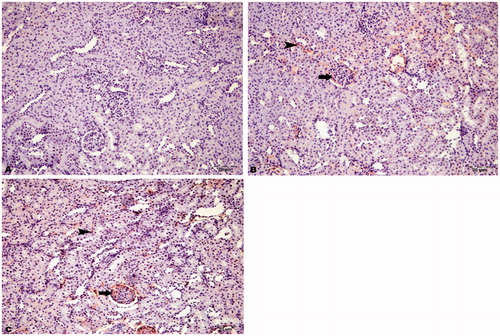
Figure 4. Immunohistochemical staining of caspase-8 in rat kidney (200×). (A) HRs showed no immunopositivity, (B) DRs showed moderate immunopositivity in tubular cells (arrowhead) and glomeruli (arrow), and (C) DRs + CN showed severe immunopositivity for caspase-8 in tubular cells (arrowhead) and glomeruli (arrow).
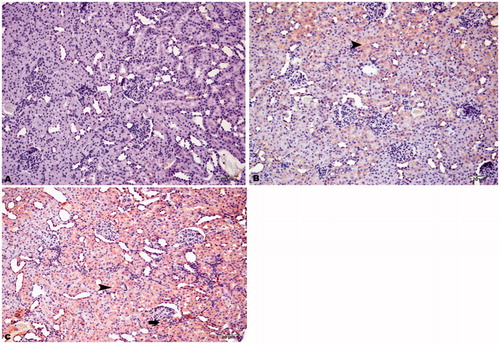
Figure 5. Immunohistochemical staining of caspase-9 in rat kidney (200×). (A) HRs showed slight immunopositivity in intertubular areas, (B) DRs showed moderate immunopositivity in tubular cells (arrowhead) and glomeruli (arrow), and (C) DRs + CN showed severe immunopositivity for caspase-9 in tubular cells (arrowhead) and glomeruli (arrow).
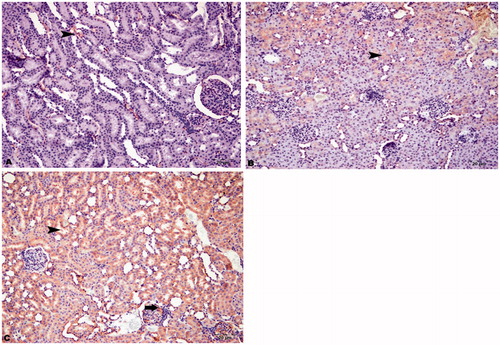
Figure 6. Immunohistochemical staining of LC3B in rat kidney (200×). (A) HRs showed no immunopositivity, (B) DRs showed moderate immunopositivity in intertubular areas (arrowhead) and glomeruli (arrow), and (C) DRs + CN showed severe immunopositivity for LC3B in intertubular areas (arrowhead) and glomeruli (arrow).
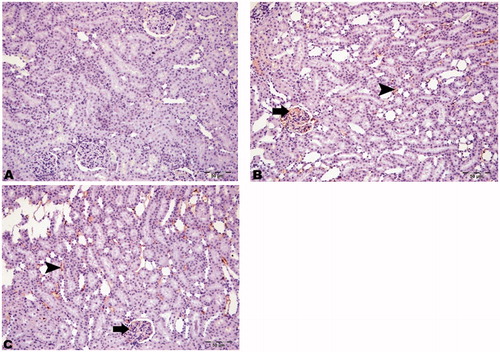
Figure 7. Immunohistochemical staining of Beclin-1 in rat kidney (200×). (A) HRs showed no immunopositivity, (B) DRs showed moderate immunopositivity in intertubular areas (arrowhead) and glomeruli (arrow), and (C) DRs + CN showed severe immunopositivity for Beclin-1 in intertubular areas (arrowhead) and glomeruli (arrow).
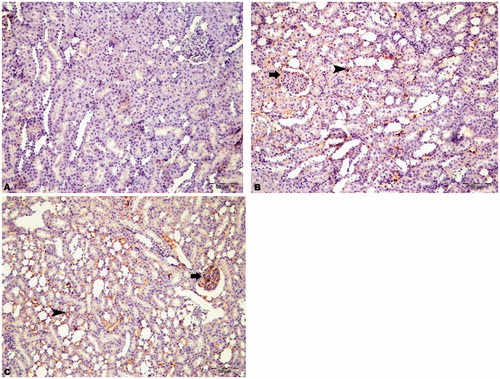
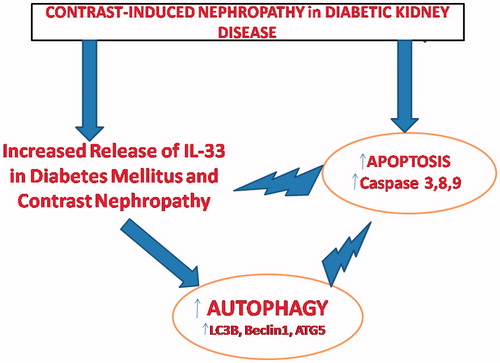
Figure 8. Schematic presentation of the relationship between IL-33, apoptosis, and autophagy in diabetic patients with contrast-induced nephropathy.