Figures & data
Figure 1. Glomerular pathology and podocyte integrity of control and ADR mice. PAS staining (upper panels) and Masson staining (middle panels) showed ADR mice developed glomerular and interstitial fibrosis. Original magnification, ×200. Electron microscopy (lower panels) indicated that the podocyte foot processes lost their normal interdigitating pattern and showed effacement instead in ADR mice (TEM × 13500).
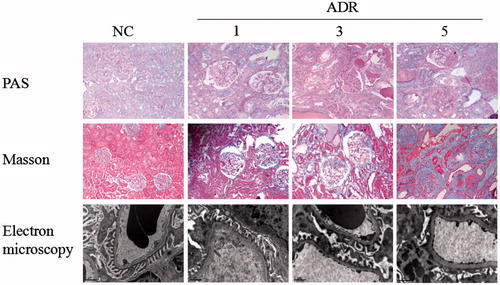
Figure 2. Level of urinary protein. Urinary protein excretion was significantly increased throughout the study period. Values = mean ± SD. A significant difference from the control value is indicated by *p < 0.05.
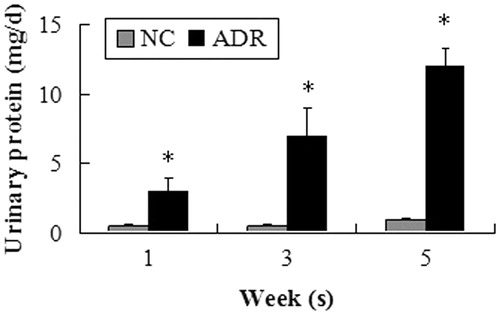
Figure 3. Expression of desmin. Podocyte in the ADR group strongly displayed the podocyte injury marker desmin. The intensities of the protein bands were quantified and normalized to β-actin. A significant difference from the control value is indicated by *p < 0.05.
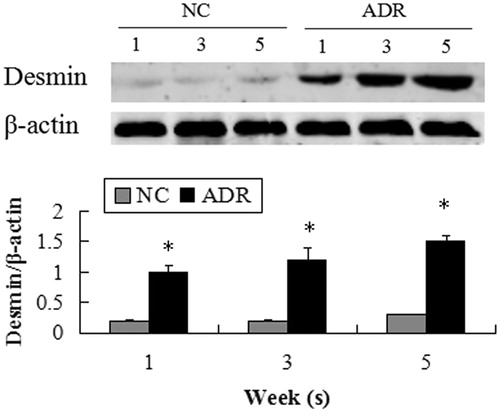
Figure 4. Expression of synaptopodin and WT1. FSGS kidneys weakly expressed cell markers synaptopodin and WT1 through the study period compared with the normal control kidneys.
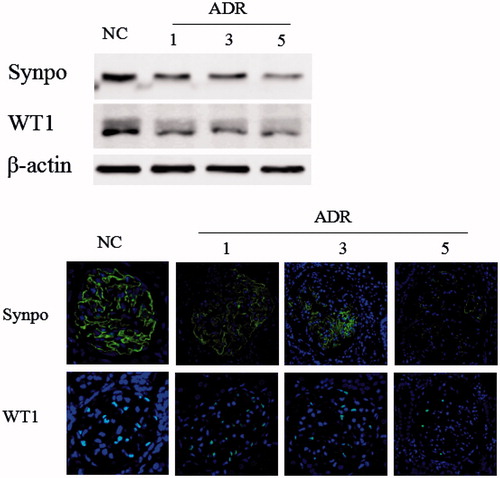
Figure 5. miR-206 expression in kidneys of ADR mice. miR-206 was up-regulated in the ADR mice during the study period. Data are expressed as the mean ± SD calculated from six mice at each time point. *p < 0.05, significant difference from the normal control group.
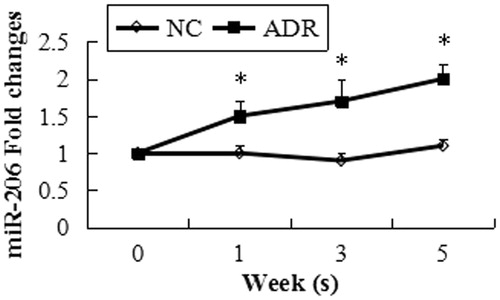
Figure 6. Dual-Luciferase reporter assays. The change in the Rluc/Fluc ratio indicates that the 3'UTR of the WT1 gene was directly targeted by miR-206. *p < 0.05.
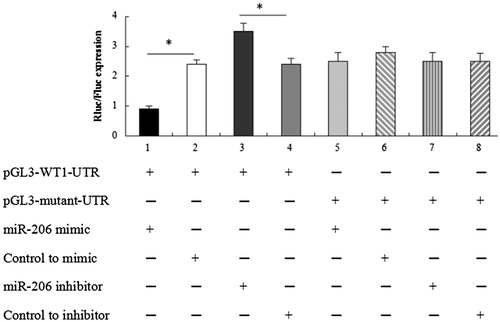
Figure 7. miR-206 promote podocyte damage. The expression of desmin significantly increased, while WT1 and synaptopodin were suppressed by transfection with miR-206 mimics compared with the miR-NC group. The intensities of the protein bands were quantified and normalized to β-actin. *p < 0.05 indicate statistically significant compared with the miR-NC group.
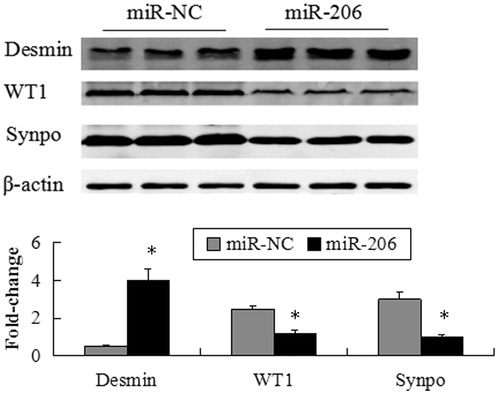
Figure 8. mRNA expression of desmin, WT1 and synaptopodin following transfection of the MPC5 cells with miR-206 mimics or miR-NC. The mRNA expression of desmin significantly increased, while WT1 and synaptopodin were suppressed by transfection with miR-206 mimics compared with the miR-NC group. *p < 0.05 indicate statistically significant compared with the miR-NC group.
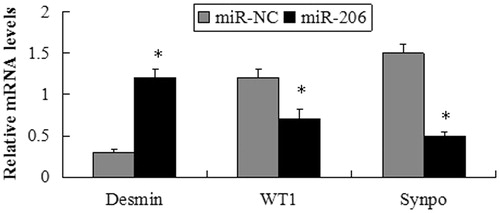
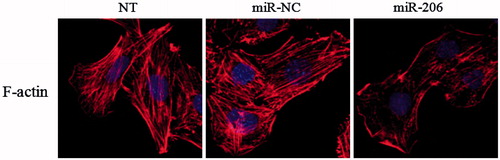
Figure 9. Effects of miR-206 on cytoskeletal stabilization in podocyte. miR-206 promoted the rearrangement of stress fibers in podocyte, causing podocyte cytoskeletal injury compared with the NT and miR-NC group.