
Figures & data
Table 1. Serological findings among RTR, HD and control groups.
Figure 1. Nested-PCR products of the GRA6 gene. T. gondii positive samples give a 344-bp band. M: 100 bp DNA marker; lane 1 positive control, lane 3 negative control, lanes 2, 4–11 positive samples.
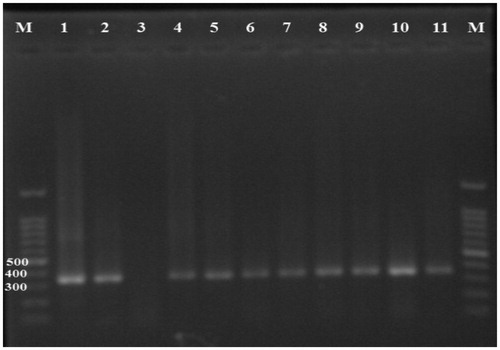
Table 2. Serological findings and clinical symptoms among PCR positive patients (hemodialysis and transplant).