Figures & data
Figure 1. Genomic distribution of 5hmC in mouse kidney. (A) HPLC analysis of genomic 5hmC and 5mC levels in mouse kidney. Data represent as mean ± SD (n = 5). (B) Left pie chart showing the percentages of different genomic feature regions in mouse genome. Right pie chart showing the percentages of 5hmC peaks in different genomic feature regions.
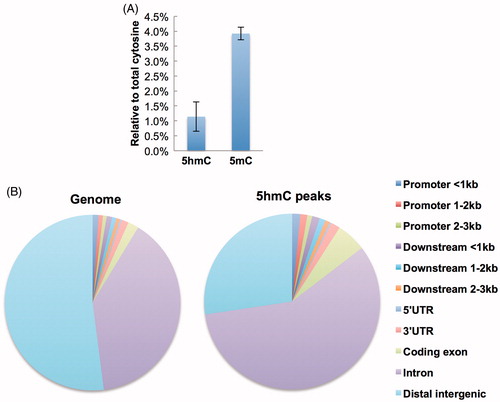
Figure 2. Genic distribution of 5hmC in mouse kidney. (A) 5hmC enrichment profiles of all Refseq genes across the promoter (left) and gene body (right) regions. (B) UCSC Genome Browser snapshots of Cxcl12 (left) and Ifngr2 (right). (C) Gene ontology analysis of genes with 5hmC peaks in promoters (TSS ±0.5 kb). (D) Gene ontology analysis of genes with 5hmC peaks in gene body regions.
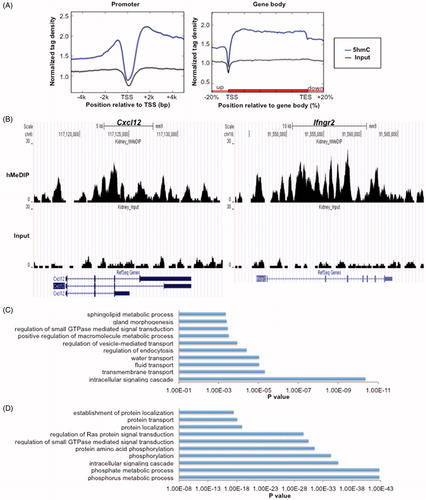
Figure 3. Relationship between 5hmC enrichment and gene expression status in mouse kidney. (A) 5hmC enrichment profiles of genes separated into five groups according to expression in mouse kidney (from low to high: 0–20%, 20–40%, 40–60%, 60–80%, and 80–100%) across promoter (left) and gene body (right) regions.(B) Box plots showing the average 5hmC density of five groups of genes in promoter (TSS ±0.5 kb) (left) and gene body (right) regions. *P<0.05.
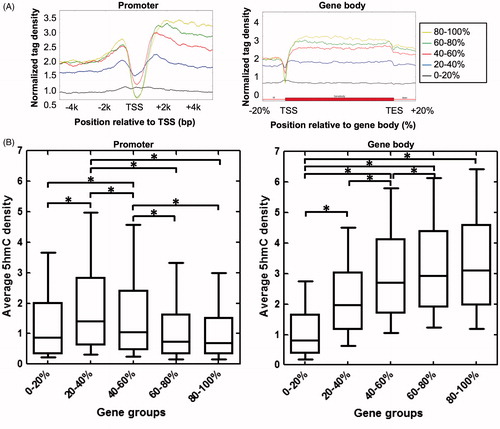
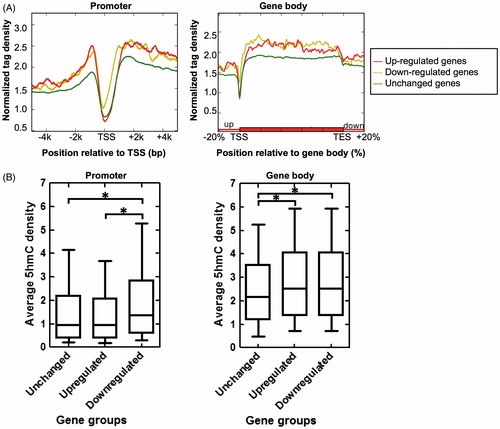
Figure 4. Relationship between 5hmC enrichment and gene expression dynamics during renal IR injury. (A) 5hmC enrichment profiles across the promoter (left) and gene body (right) regions of unchanged, up-regulated, and down-regulated genes. (B) Box plots showing the average 5hmC density of unchanged, up-regulated, and down-regulated genes in promoter (TSS ±0.5 kb) (left) and gene body (from TSS to TES) (right) regions. *P<0.05.