1,465
Views
14
CrossRef citations to date
0
Altmetric
Research Article

Critical role of activation induced cytidine deaminase in Experimental Autoimmune Encephalomyelitis

, , , , , , , , , , , , , , , , , , , , & show all
Pages 157-167 | Received 08 Nov 2012, Accepted 09 Nov 2012, Published online: 18 Jan 2013

Figures & data

Figure 1.  Generation and functional characterization of Aicda deficient mice. A) Gene targeting strategy used to delete the catalytic domain (exon-3) of Aicda locus. The structure of the AID domains is shown in top. The location of the homology arms in the targeting vector is indicated. The schematic of targeting construct used to delete the catalytic domain of AID (exon-3) is shown in the middle. The solid triangles represent Cre recombination sites and the Neomycin cassette was subsequently removed by expression of Cre-recombinase. Representative WT or KO PCR products using 3′ or 5′ arm analysis at the Aicda locus is shown in the right panel. The size of Aicda KO PCR product is indicated and corresponds to the modified locus. Notice that one primer is located in the Neomycin cassette and therefore only detects the targeted Aicda locus. B) FACS analysis of LPS/IL4 stimulated WT or AID KO B cells in vitro. Percentage of IgM or IgG1 are indicated in each quadrant. B220-FITC is used as a B-cell marker.
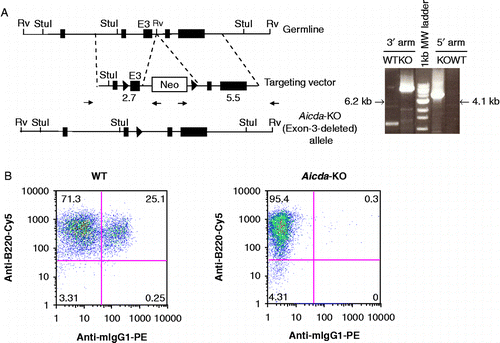
Figure 1.  Generation and functional characterization of Aicda deficient mice. A) Gene targeting strategy used to delete the catalytic domain (exon-3) of Aicda locus. The structure of the AID domains is shown in top. The location of the homology arms in the targeting vector is indicated. The schematic of targeting construct used to delete the catalytic domain of AID (exon-3) is shown in the middle. The solid triangles represent Cre recombination sites and the Neomycin cassette was subsequently removed by expression of Cre-recombinase. Representative WT or KO PCR products using 3′ or 5′ arm analysis at the Aicda locus is shown in the right panel. The size of Aicda KO PCR product is indicated and corresponds to the modified locus. Notice that one primer is located in the Neomycin cassette and therefore only detects the targeted Aicda locus. B) FACS analysis of LPS/IL4 stimulated WT or AID KO B cells in vitro. Percentage of IgM or IgG1 are indicated in each quadrant. B220-FITC is used as a B-cell marker.

Figure 2.  Aicda-deficient (Aicda KO) and uMT-deficient (uMT KO) are resistant to rhMOG induced EAE. Development of EAE in Aicda KO and uMT KO animals (A) and average daily clinical score (B; p < 0.0001 by Oneway Dunnet's test for Aicda KO as compared to Aicda WT and p < 0.0001 for uMT KO and compared to uMT WT). Immunohistochemistry of spinal cord, lumbar. D, F: Aicda.wt (1–1630). E, G Aicda KO (2–1613). Mild superficial myelinopathy characterized by polymicrocavitation of myelin (arrowheads) and sparse leptomeningeal collections of mononuclear cells (arrows) are consistent with mild, subacute to chronic EAE. Corresponding lesions are absent in a representative section from an Aicda KO animal. Bar = 200 μm D, E); 50 μm F, G). WM = white matter; GM = gray matter. Boundary between gray and white matter outlined with dashed line.
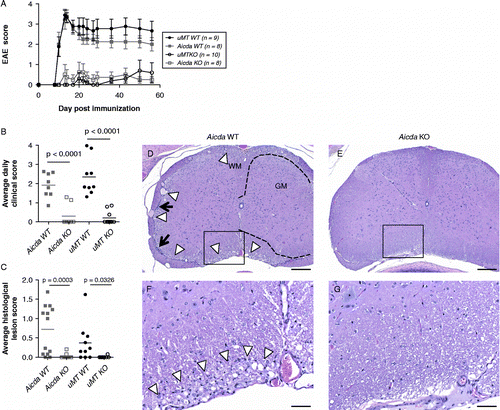
Figure 2.  Aicda-deficient (Aicda KO) and uMT-deficient (uMT KO) are resistant to rhMOG induced EAE. Development of EAE in Aicda KO and uMT KO animals (A) and average daily clinical score (B; p < 0.0001 by Oneway Dunnet's test for Aicda KO as compared to Aicda WT and p < 0.0001 for uMT KO and compared to uMT WT). Immunohistochemistry of spinal cord, lumbar. D, F: Aicda.wt (1–1630). E, G Aicda KO (2–1613). Mild superficial myelinopathy characterized by polymicrocavitation of myelin (arrowheads) and sparse leptomeningeal collections of mononuclear cells (arrows) are consistent with mild, subacute to chronic EAE. Corresponding lesions are absent in a representative section from an Aicda KO animal. Bar = 200 μm D, E); 50 μm F, G). WM = white matter; GM = gray matter. Boundary between gray and white matter outlined with dashed line.

Table 1.  Incidence and disease induction in uMT- or AID- deficient mice.

Figure 3.  Similar state of T cell activation in draining lymph nodes and post antigenic stimulation. A, Total cell numbers in two DLNs of WT and Aicda KO mice. B, T cell activation is normal in Aicda KO mice. DLN cells were stained with CD4, CD8, CD44 and CD62L and analyzed by flow cytometry. C) Aicda KO mice do not show defect in the MOG-specific T cell IL-17 production. WT and Aicda KO mice were immunized with MOG and 10 days later, draining lymph node cells from mice were isolated and cultured with various concentrations of rMOG or MOG35–55 peptide for 4 days and subsequently the supernatants were collected and analyzed by Luminex.
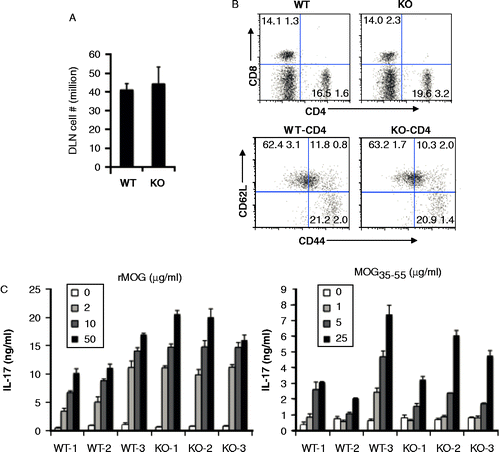
Figure 3.  Similar state of T cell activation in draining lymph nodes and post antigenic stimulation. A, Total cell numbers in two DLNs of WT and Aicda KO mice. B, T cell activation is normal in Aicda KO mice. DLN cells were stained with CD4, CD8, CD44 and CD62L and analyzed by flow cytometry. C) Aicda KO mice do not show defect in the MOG-specific T cell IL-17 production. WT and Aicda KO mice were immunized with MOG and 10 days later, draining lymph node cells from mice were isolated and cultured with various concentrations of rMOG or MOG35–55 peptide for 4 days and subsequently the supernatants were collected and analyzed by Luminex.

Figure 4.  Characterization of anti-MOG antibodies using ELISA at day zero and 28. A) IgG anti-rhMOG, B) IgM anti-rhMOG, C) IgG anti-MOG peptide 35–55, D) IgM anti-MOG peptide 35–55. Mixed day 28 sera of WT or KO immunized mice were used as standard (arbitrarily defined as 100 U) for IgG or IgM antibodies, respectively. E) IgM binding to rhMOG coated at different concentrations. Sera from 8 mice were pooled for each of the following sample sets: Day 0 WT, Day 0 KO, Day 28 WT, and Day 28 KO. Pooled mice sera IgM Abs normalized at 0.1 mg/ml in the assay. Anti-mouse IgM was used as detection to exclusively measure the binding of IgM antibodies in serum.
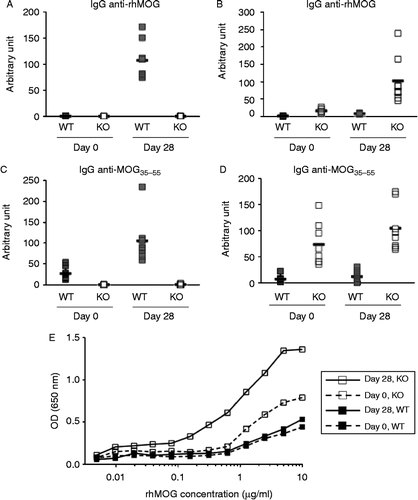
Figure 4.  Characterization of anti-MOG antibodies using ELISA at day zero and 28. A) IgG anti-rhMOG, B) IgM anti-rhMOG, C) IgG anti-MOG peptide 35–55, D) IgM anti-MOG peptide 35–55. Mixed day 28 sera of WT or KO immunized mice were used as standard (arbitrarily defined as 100 U) for IgG or IgM antibodies, respectively. E) IgM binding to rhMOG coated at different concentrations. Sera from 8 mice were pooled for each of the following sample sets: Day 0 WT, Day 0 KO, Day 28 WT, and Day 28 KO. Pooled mice sera IgM Abs normalized at 0.1 mg/ml in the assay. Anti-mouse IgM was used as detection to exclusively measure the binding of IgM antibodies in serum.

Figure 5.  Surface plasmon resonance (SPR) analysis of serum antibody binding to MOG. A. SPR sensorgrams of serum samples binding to sensor immobilized MOG. Serum from 8 mice were pooled for each of the following sample sets: Day 0 WT, Day 0 KO, Day 28 WT, and Day 28 KO. Start and stop injection times are indicated by arrows. Day 28 WT serum showed the highest binding response, and the majority of this binding signal could be competed with soluble MOG (2 uM) preincubated with the serum sample before injection. B. Detection of the major binding isotype in Day 28 WT serum. Subsequent injections of three anti-isotype antibodies were used to probe the MOG bound component. Start and stop injection times are indicated by arrows for each sample (Day 28 WT serum, anti-mIgM, anti-mIgG2a and anti-mIgG1). The data indicate that the majority of the binding signal is specific to IgG1. No background binding of anti-mIgG1 to MOG alone was detected (data not shown).
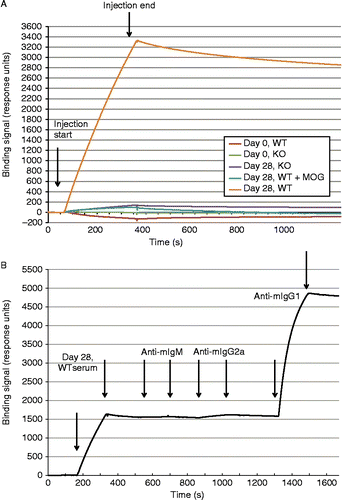
Figure 5.  Surface plasmon resonance (SPR) analysis of serum antibody binding to MOG. A. SPR sensorgrams of serum samples binding to sensor immobilized MOG. Serum from 8 mice were pooled for each of the following sample sets: Day 0 WT, Day 0 KO, Day 28 WT, and Day 28 KO. Start and stop injection times are indicated by arrows. Day 28 WT serum showed the highest binding response, and the majority of this binding signal could be competed with soluble MOG (2 uM) preincubated with the serum sample before injection. B. Detection of the major binding isotype in Day 28 WT serum. Subsequent injections of three anti-isotype antibodies were used to probe the MOG bound component. Start and stop injection times are indicated by arrows for each sample (Day 28 WT serum, anti-mIgM, anti-mIgG2a and anti-mIgG1). The data indicate that the majority of the binding signal is specific to IgG1. No background binding of anti-mIgG1 to MOG alone was detected (data not shown).

Figure 6.  Indirect fluorescence for binding of serum antibody to normal brain tissue. Serum from EAE affected WT mice show diffuse, strong white matter associated signal consistent with the presence of MOG specific IgG1. By contrast, corresponding signal is absent using serum from MOG induced KO mice, or healthy controls. There is no difference of signal intensity or distribution for IgM binding to brain, regardless of MOG induction or genotype. Representative images are shown.
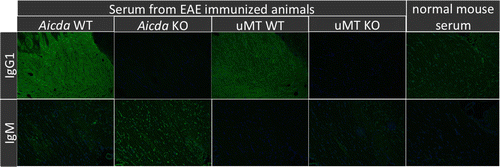
Figure 6.  Indirect fluorescence for binding of serum antibody to normal brain tissue. Serum from EAE affected WT mice show diffuse, strong white matter associated signal consistent with the presence of MOG specific IgG1. By contrast, corresponding signal is absent using serum from MOG induced KO mice, or healthy controls. There is no difference of signal intensity or distribution for IgM binding to brain, regardless of MOG induction or genotype. Representative images are shown.