Figures & data
Table 1. Clinical and flow cytometric profiles.
Figure 1. Frequencies of EBV-reactivated cells increased during 33 °C culture. Precultured PBMCs were further cultured at 33 °C from days 0 to 12 for EBV reactivation. The cells were collected at days 0 and 12 and analyzed by flow cytometry. We used anti-EBV-gp350/220 antibody called 72A1 and Alexa Fluor488 to detect EBV-reactivated cells. TRAb-positive cells were shown by APC. Compared with day 0, the frequencies of 72A1(+) cells increased at day 12, in both patients and controls.
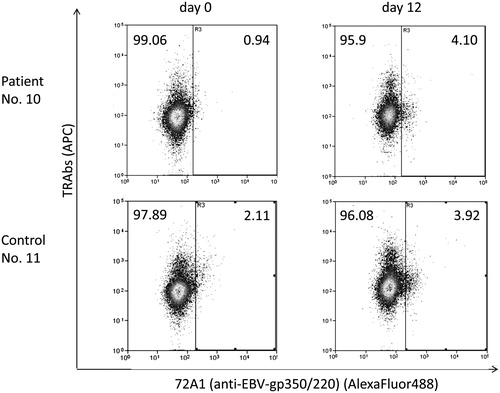
Figure 2. TRAb(+) 72A1(+) cells had characteristics of antibody-producing cells. TRAb(+) 72A1(+) cells were sorted and observed through a confocal laser microscope. Red spots of APC representing TRAbs were observed inside the cells, and green signals of Alexa Fluor488 representing 72A1 were detected inside or on the surface of the cells. The cytoplasm was abundant, and the nucleus was slightly deformed.
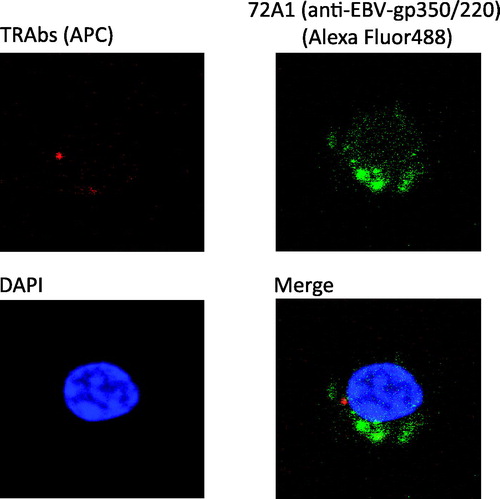
Figure 3. Schedule of culture fluid sampling and definition of delta (Δ). We transferred 37 °C precultured PBMCs to 33 °C at day 0. On days 0, 5, 10 and 12, we collected half of each culture fluid and replaced it with fresh medium. Upon this change of half of the medium, the TRAb concentration of the culture fluid was halved. We calculated the increase of TRAb concentration from half of that at one term before the sampling day, which we regarded as delta (Δ).
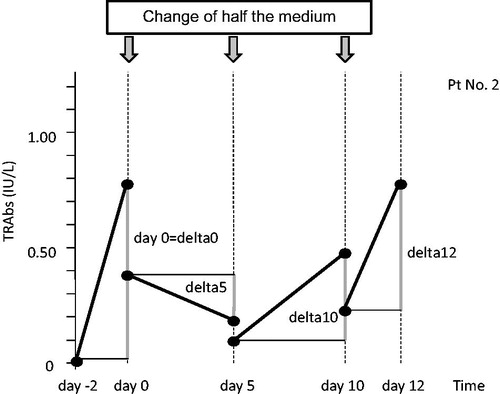
Table 2. (A) TRAb levels in 33 °C culture fluid (IU/l) and (B) TRAb levels in 37 °C culture fluid (IU/l).
Figure 4. TRAbs released from PBMCs cultured at 33 °C (EBV reactivation) and 37 °C (no induction of EBV reactivation). We compared the sum of Δ of the TRAb concentration in culture fluids at 33 and 37 °C. In three analyses of Δ0–Δ12 (Δ0 + Δ5 + Δ10 + Δ12), Δ5–Δ12 (Δ5 + Δ10 + Δ12) and Δ10–Δ12 (Δ10 + Δ12), the sums of Δ of TRAb concentration at 33 °C were significantly higher than those at 37 °C.
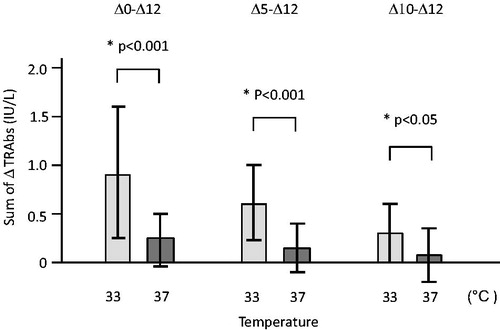
Figure 5. Representative courses of the TRAb concentration changes by EBV-reactivation induction in 33 °C culture fluids of three patient PBMCs and three control PBMCs. (a) Controls and (b) patients.
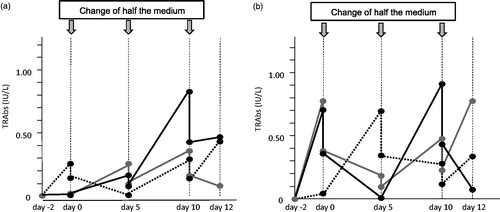
Figure 6. Difference of TRAb levels released from 33 °C PBMC culture (EBV-reactivation induction) between patients and controls. The sums of Δ0–Δ12 (Δ0 + Δ5 + Δ10 + Δ12) of TRAb concentration were significantly higher in patients than in controls (p < 0.05).
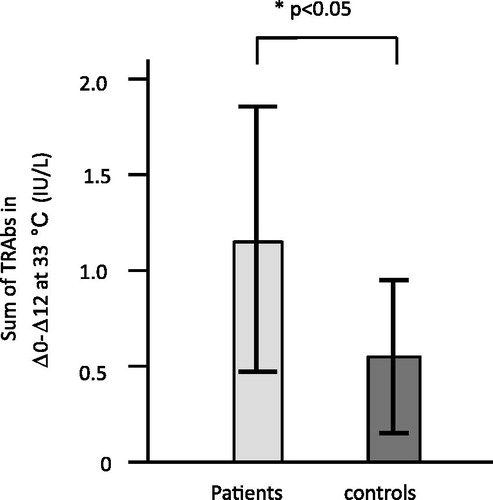
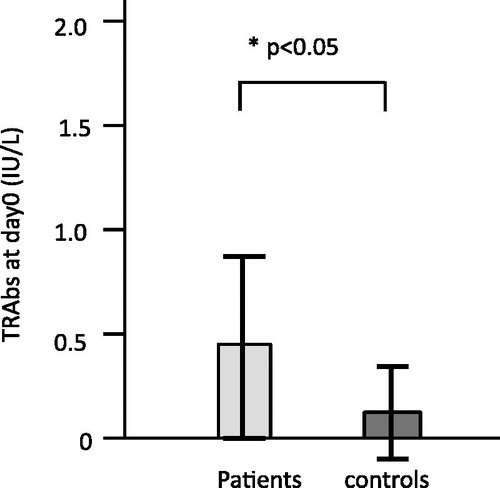
Figure 7. TRAb release in PBMC culture for patients and controls at day 0 (preinduction stage of EBV reactivation). The TRAb secretion at day 0 was supposed to be influenced by preculture, especially the added cyclosporine A. We compared the TRAb concentrations at day 0, and the concentration in patients was significantly higher (p < 0.05) than in controls.