Figures & data
Figure 1. Concept and protocol of the QUANTA Flash assays. Figure panel (a) illustrates the QUANTA Flash assay cartridge design, which is a key feature making the BIO-FLASH easy to use. Panel (b) shows the overview of QUANTA Flash assay scheme. The procedure involves three reactions (capture of the antibody of interest from the sample by the antigen coupled to the beads; recognition with the ABEI-labelled antibody; chemiluminescent measuring) separated by two washing steps. All steps are performed automatically by BIO-FLASH. Panel (c) illustrates the chemical reaction of the light emission. Using an amide linkage (or pseudo-peptide), the antigen (Ag) or antibody (Ab), indicated as an R in the figure, is attached to the aminobutylethylisoluminol (ABEI) molecule separated by a spacer, therefore reducing the quenching effect of the protein. In the presence of H2O2, a catalyst and high pH, light is emitted. The height and width of the peak of light depends upon the quantity of ABEI captured by the bead, which is directly proportional to the concentration of relevant analyte present in the patient sample. The output is measured over 3 s (from second 9 to second 12) and yields a number value in relative light units (RLUs). In (d), an example of Master (dotted) and Working (green solid) curve is illustrated above. The RLUs are expressed on the y-axis and chemiluminescent units (CU) on the x-axis.
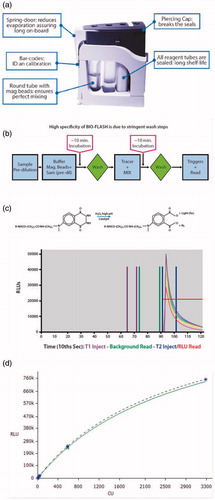
Figure 2. Illustration of the high surface capacity of paramagnetic beads in comparison to conventional ELISA. Paramagnetic beads provide a significantly higher surface area compared to ELISA plates and are able to bind more antigen or antibody which often results in high analytical sensitivity and a broad analytical measuring range.
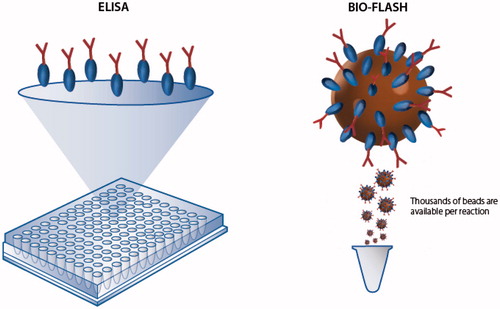
Table 1. Overview of QUANTA flash assays.
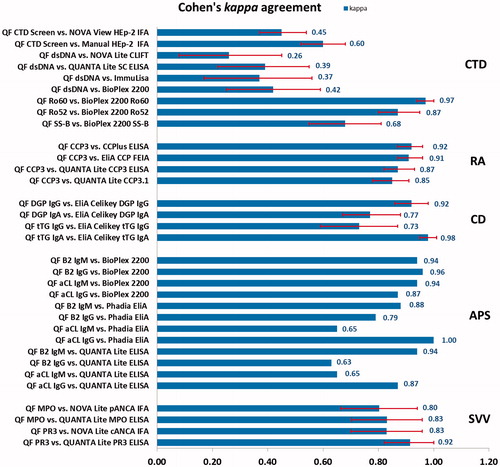
Figure 3. Agreement between QUANTA Flash assays and other autoantibody detection methods according to Cohen’s kappa agreement test. Red error bars indicate 95% confidence intervals (CI), although not available for all published studies. QF, QUANTA Flash; CTD, connective tissue disease; RA, rheumatoid arthritis; CD, celiac disease; APS, anti-phospholipid syndrome; SVV, small vessel vasculitis.